Wealth management dashboards have become essential tools for financial advisors and wealth managers, offering a streamlined way to monitor and analyze vast amounts of data. In today’s fast-paced economic environment, quickly accessing real-time insights into portfolios, client assets, and market trends is crucial.
Related posts:
- 6 Amazing Tableau Bank Dashboard Examples
- 7 Great Examples of Insurance Dashboards in Tableau
- 13 Amazing Tableau Financial Dashboards for Financial Mastery
- Check Out 13 Amazing Tableau Marketing Dashboard Examples
- Uncover Hidden Threats: How a Fraud Dashboard Can Transform Your Business Security
- 5 Powerful Revenue Dashboard Examples to Track & Boost Your Business Growth
A well-designed wealth management dashboard provides a comprehensive view of key performance indicators (KPIs), enabling managers to make informed decisions, optimize strategies, and enhance client relationships.
Table of Contents
From tracking net new money and asset allocations to evaluating advisor performance and client engagement, these dashboards leverage advanced wealth management data analytics to deliver actionable insights. They help managers identify trends, mitigate risks, and capitalize on opportunities, all within a user-friendly interface. This blog post will explore the importance of wealth management dashboards, the key features they offer, and how they can revolutionize how you manage and grow your wealth management practice through practical data analytics in wealth management.
1. Wealth Management Dashboard
This wealth management dashboard provides a comprehensive overview of client details and key financial metrics tailored for effective wealth management analytics. The money management dashboard is divided into two primary sections: Client Overview and Client Details.

In the Client Overview section, the wealth management dashboard presents a range of visualizations, including bar charts, pie charts, and tables, to showcase data such as the total number of clients, funds under management (FUM), and monthly contributions. A bar chart highlights the top five products by FUM, while another breaks down client FUM by risk level (low, medium, high). A pie chart visualizes client contributions (yearly, quarterly, monthly), providing a clear snapshot of client engagement.
The Client Details section offers more profound insights into individual client data. Here, a histogram displays the age distribution of clients, helping wealth managers understand the demographic spread. A pie chart segments clients by gender, providing quick insights into the client base. Below these charts, a detailed table lists each client’s ID, gender, age, join date, FUM, contribution type, and disposable income, allowing wealth managers to drill down into specific client details.

Wealth managers can use this wealth management data analytics tool to track client performance, identify trends, and make informed decisions. The combination of high-level summaries and detailed client data supports efficient resource allocation, tailored financial advice, and prioritization of client engagement based on critical metrics like FUM, client growth, and demographic distribution, demonstrating the power of data analytics in wealth management.
2. Demo Wealth and Banking
This wealth management dashboard offers a detailed view of an advisor’s key performance indicators (KPIs) related to asset management, client engagement, and process efficiency. Designed to enhance wealth management analytics, it allows wealth managers to monitor and improve advisor performance with a clear, data-driven overview of various metrics.

The wealth management dashboard features a range of charts and visualizations, including line charts, bar charts, and tables. Line charts track the advisor’s assets under management (AUM), number of assets, clients, and average pipeline duration over time, providing insights into trends and changes. Bar charts display advisor comparisons, highlighting rankings in categories such as assets under management and number of clients. Tables offer detailed information on overdue items, top at-risk assets, and average time spent in each stage of the client onboarding process.
Wealth managers can leverage this wealth management data analytics tool to assess individual advisor performance and identify areas for improvement quickly. By analyzing SLA (Service Level Agreement) completion rates, managers can determine if advisors meet client expectations and adhere to timelines. The dashboard also highlights top at-risk assets, enabling wealth managers to address potential issues before they impact client satisfaction proactively.
This wealth management dashboard is a powerful tool for making data-driven decisions, optimizing advisor performance, and ensuring effective client relationship management. Integrating real-time data analytics in wealth management supports a proactive approach to managing and growing wealth management practices.
3. Wealth Management Asset Evaluation
This wealth management dashboard offers a comprehensive overview of fund performance, focusing on current fund value, changes in asset values, and the impact of individual managers and sectors on overall portfolio performance. It serves as a vital tool in wealth management analytics, enabling managers to monitor and optimize investment strategies effectively.

The money management dashboard presents critical financial information using various charts and visualizations. Line charts track the total fund value over time, showcasing trends and fluctuations. Bar charts display the value of funds managed by each manager, providing a comparative view of team performance. Additional line charts highlight the top five funds with the largest positive and negative changes in value, offering insights into which investments are excelling and which are underperforming.
Furthermore, the wealth management data analytics dashboard categorizes asset value by sector, using bar charts to depict the distribution of investments across industries such as Construction Services, Technology, and Consumer Goods. This helps wealth managers understand sector exposure and identify areas for rebalancing.
Wealth managers can use this dashboard to gain a detailed understanding of fund performance at various levels. By utilizing data analytics in wealth management, they can identify top-performing managers and sectors, assess the impact of market changes, and make informed decisions on resource allocation. The insights gained are essential for optimizing investment strategies, managing risks, and maximising client returns.
4. Wealth Management
This wealth management dashboard is designed to track and analyze net new money, providing a detailed view of regional manager performance, state performance, product performance, and top advisor contributions. It is a powerful tool in wealth management analytics, enabling managers to assess financial health, identify trends, and make informed decisions using real-time data.

The wealth management dashboard features various visualizations, including bar charts, line charts, and tables, to present critical metrics effectively. Bar charts compare performance across different states and products, while line charts illustrate monthly fluctuations in net new money for each regional manager. The dashboard also highlights top advisors, ranking them by their contributions, with bar charts showcasing individual performance against targets.

In addition, the money management dashboard provides an overview of total sales, total revenue, and assets, along with metrics for financial advisors (FAs) and ACAT (account transfers). These metrics are crucial for understanding business performance and tracking progress toward financial goals.
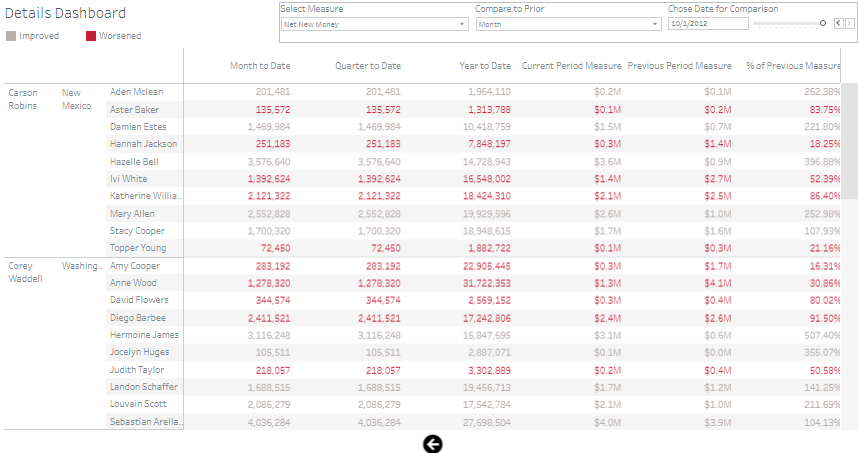
The accompanying details dashboard offers a granular view of performance data, allowing wealth managers to compare month-to-date, quarter-to-date, and year-to-date figures against previous periods. The table format uses colour coding to highlight improvements and declines, enabling managers to identify areas needing attention quickly.
Wealth managers can leverage wealth management data analytics to monitor key performance indicators (KPIs) across regions, products, and advisors. This data analytics in wealth management allows them to pinpoint strengths and weaknesses, take strategic actions to optimize performance, and ensure consistent growth in net new money.
5. Wealth Portal
This wealth management dashboard comprehensively analyses new net money performance across different regions, products, and advisors. It is an essential tool for wealth managers to track and optimize financial performance, leveraging real-time data to make informed decisions.

The dashboard features various visualizations, including bar charts, line charts, and area charts. The executive summary section prominently displays the year-to-date (YTD) new net money, with comparisons to the previous year (PY), offering a quick snapshot of overall performance. Bar charts break down YTD regional new net money and product performance, allowing managers to see which regions and products drive growth or lag.

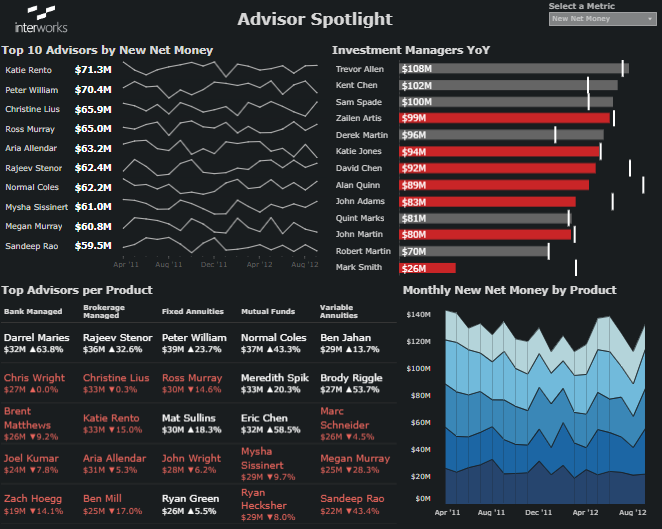
In the advisor spotlight section, line charts track the top 10 advisors by new net money over time, highlighting their contributions and performance trends. Additional bar charts focus on investment managers’ year-over-year (YoY) performance, giving insights into their impact on the firm’s financial health. The monthly new net money by-product is displayed using an area chart, showing how different products contribute to the firm’s bottom line over time.
5 Wealth Management Dashboard Examples
Wealth managers can use this money management dashboard to monitor key performance indicators (KPIs) related to net new money, identify top-performing regions, products, and advisors, and assess investment managers’ effectiveness. By utilizing wealth management data analytics, managers can make data-driven decisions to optimize performance, allocate resources effectively, and ensure consistent growth. This dashboard is a crucial tool in data analytics in wealth management, helping managers stay ahead in a competitive financial landscape.


