A trading dashboard is a powerful tool to deliver real-time insights into critical metrics, helping traders, analysts, and executives optimize strategies and enhance outcomes. Whether you’re analyzing trade volume, assessing trader performance, or monitoring sector trends, a thoughtfully designed dashboard for trading can simplify complex data and provide actionable insights.
This blog post presents nine examples of trading dashboards, each highlighting unique use cases and visualizations. These examples demonstrate how trading dashboards can transform data into impactful insights that drive financial success.
Table of Contents
# 1 Trading Dashboard – Home
The trading dashboard visualizes key metrics for a trading environment, precisely trade volume and total revenue. It highlights two main numerical metrics: $2,119.9B for trade volume and $25,588M for total revenue. Bar charts support these figures by breaking down trade performance by trade type, such as Trade Type 1, 2, 3, and 4. These charts provide insights into how each type contributes to the overall metrics.
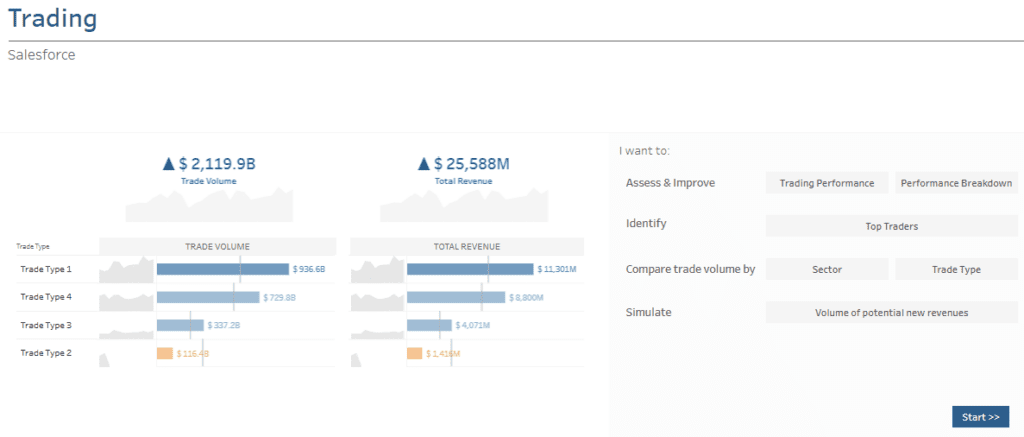
Each trade type is analyzed for trade volume and total revenue; horizontal bar charts illustrate their contributions. Small line graphs above the bars offer additional context, showing trends over time for each trade type. This allows users to evaluate performance dynamics across different periods.
The right-hand side of the trading dashboard provides actionable options divided into categories, such as assess and improve (focusing on trading performance and performance breakdown), identify (top traders), compare (trade volume by sector or type), and simulate (volume of potential new revenues). These features enable users to explore and analyze the data interactively.
This trading dashboard is handy for traders, financial analysts, and managers. It helps users identify high-performing trade types, compare performance across sectors, and simulate strategies to enhance revenue and optimize trading outcomes. Trading dashboards like this streamline analysis and decision-making.
# 2 Trading Dashboard – Executive Summary
The trading dashboard provides a comprehensive executive summary of trading performance metrics. It highlights key data points such as trade volume ($2,119.9B), the number of trades (480,656), total revenue ($25,588M), average commission rate (1.207%), revenue per client ($11,418K), and the number of clients (2,241). The dashboard also shows year-to-date comparisons with the previous year, helping users track performance growth or decline.
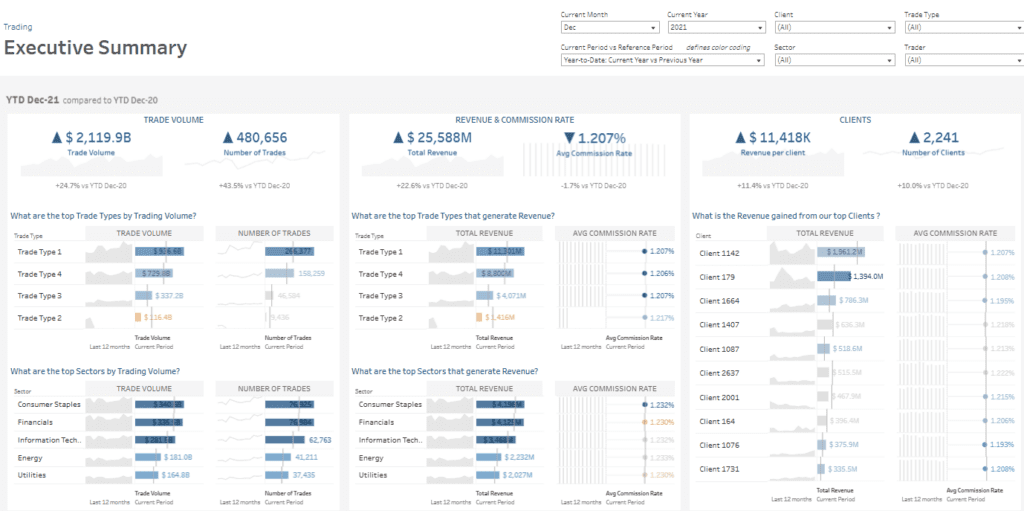
This trading dashboard includes horizontal bar charts for trade volume, total revenue, and average commission rate, broken down by trade types and sectors. Trend lines showing performance over the last 12 months complement these visualizations, enabling users to assess patterns and changes over time. Additionally, client-specific charts show top clients’ total revenue and average commission rates.
This trading dashboard is highly valuable for traders, financial analysts, and managers responsible for strategic decision-making. It enables them to identify high-performing trade types, sectors, and clients while evaluating commission rates. By offering actionable insights, such as which trade types or clients drive the most revenue, trading dashboards allow users to optimize strategies, enhance client targeting, and improve profitability.
# 3 Trading Dashboard – Breakdown
This trading dashboard provides a detailed breakdown of trading performance metrics, focusing on trade volume, total revenue, number of clients, and trade volume per client. The dashboard tracks performance over time, offering year-to-date comparisons against the previous year to highlight growth trends. Key metrics displayed include $2,119.9B in trade volume, $25,588M in total revenue, 2,241 clients, and $946.0M in trade volume per client.
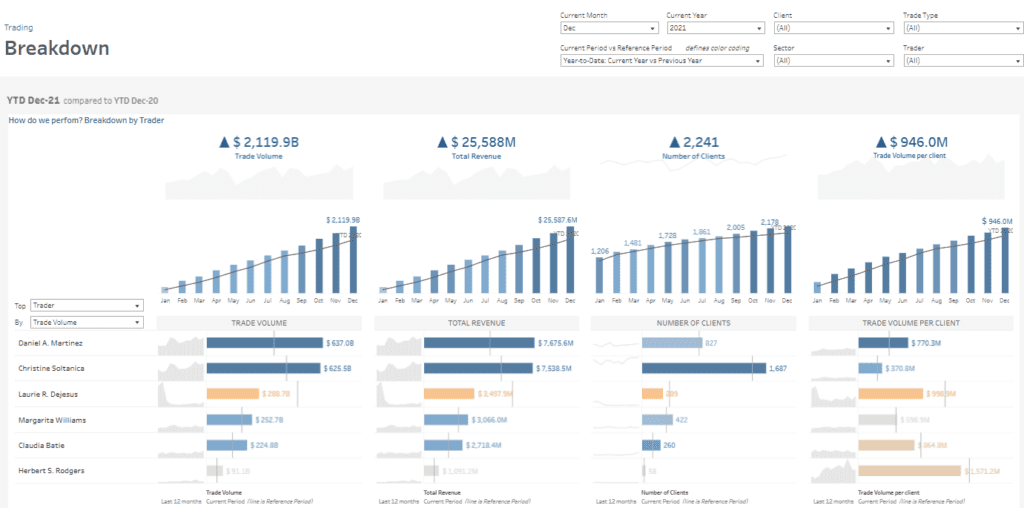
The dashboard effectively visualizes data using various charts. Line charts illustrate cumulative performance trends over the months, making it easy to observe growth patterns. Horizontal bar charts display individual contributions by traders to metrics like trade volume, total revenue, and the number of clients, with accompanying trend lines showing changes over time. This combination of chart types offers both macro and micro-level insights into performance.
This dashboard is handy for trading managers, financial analysts, and executive teams responsible for performance evaluation. It enables users to identify top-performing traders, analyze trends in client acquisition, and understand trade volume distribution. By providing actionable insights, this trading dashboard helps stakeholders optimize trader performance, improve client engagement strategies, and drive overall profitability in trading operations. Trading dashboards like this ensure data-driven decision-making.
# 4 Trading Dashboard – Traders
This trading dashboard focuses on traders’ activities, providing insights into top traders, their performance, and the areas where they trade. Key metrics such as total revenue, the number of trades, and total trade volume are displayed for individual traders. The dashboard also analyzes trade volume by type and sector, offering a comprehensive view of trading patterns.
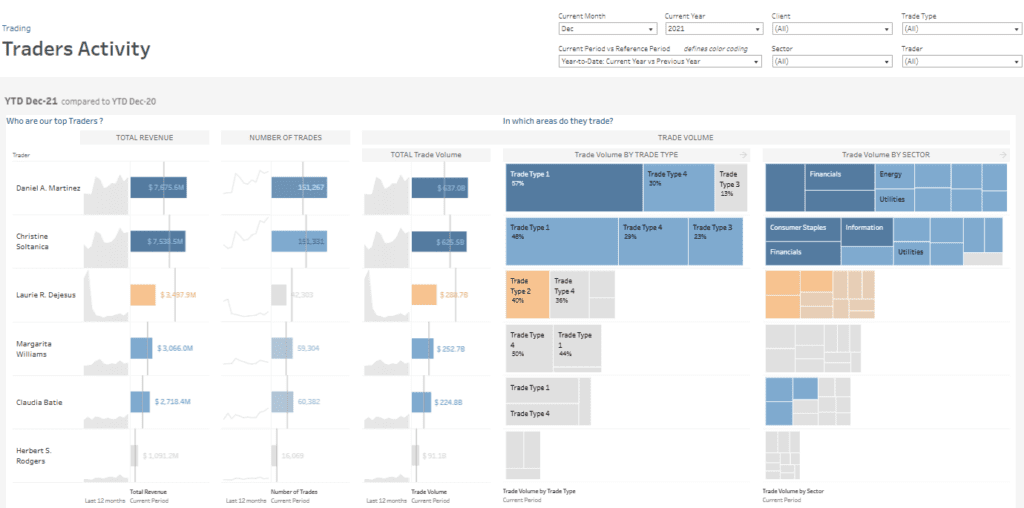
The dashboard effectively visualizes data using various chart types. Vertical bar charts display each trader’s total revenue, number of trades, and trade volume, with accompanying trend lines showing performance over time. Treemap visualizations illustrate the distribution of trade volume by trade type and sector, enabling users to see the proportional contributions of different categories. The combination of these charts provides granular and aggregated perspectives on trading activity.
This dashboard is particularly valuable for trading managers, team leaders, and financial analysts who must monitor individual trader performance, evaluate trade type distributions, and identify high-performing sectors. Users can optimise strategies, allocate resources more effectively, and improve overall trading outcomes by offering actionable insights, such as which trade types or sectors drive the most volume and revenue. This dashboard for trading ensures data-driven decision-making and enhanced trader management.
# 5 Trading Dashboard – Trade Types
This trading dashboard provides a detailed analysis of traders’ activities, showcasing metrics like total revenue, number of trades, and total trade volume. It highlights individual trader performance and explores trade volume by type and sector, offering a clear breakdown of trading patterns. Thus, it enables users to identify top-performing traders and understand their contributions to overall metrics.
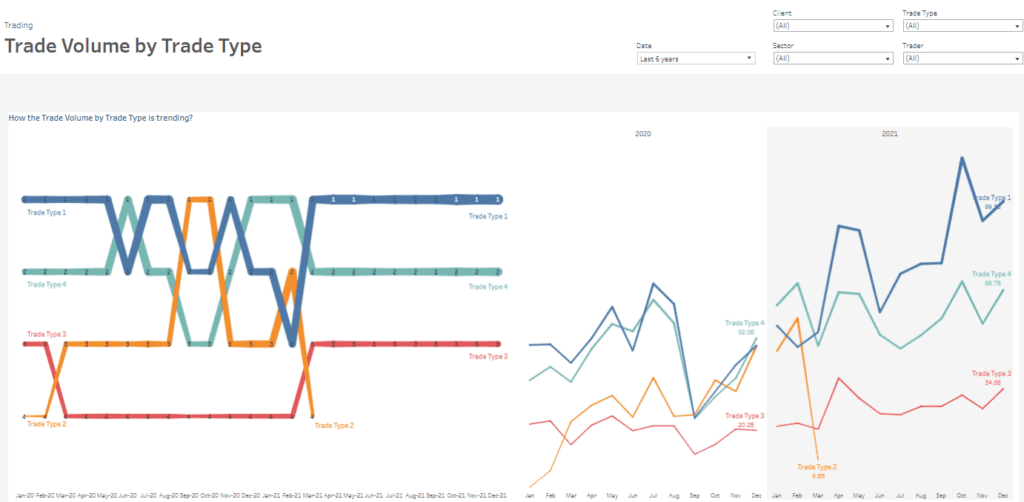
The trading dashboard effectively presents data using a variety of chart types. Vertical bar charts display total revenue, number of trades, and trade volume per trader, accompanied by trend lines highlighting performance changes over time. Treemap visualizations showcase the distribution of trade volume across trade types and sectors, providing an easy-to-interpret, proportional view of trading activity. These visuals allow for granular and high-level insights.
Trading dashboards like this are invaluable for trading managers, team leaders, and financial analysts. They help users monitor individual trader performance, evaluate which trade types and sectors contribute most to revenue, and uncover growth opportunities. By delivering actionable insights, this dashboard supports better resource allocation, enhances trading strategies, and drives improved decision-making. It is a critical tool for optimizing operations and ensuring success in a competitive trading environment.
# 6 Trading Dashboard – Sectors
This trading dashboard highlights trade volume trends across various sectors, offering an in-depth view of sector performance over time. The data is segmented into industries such as Consumer Staples, Financials, Information Technology, Energy, Industrials, and others, providing a detailed breakdown of trading activity.
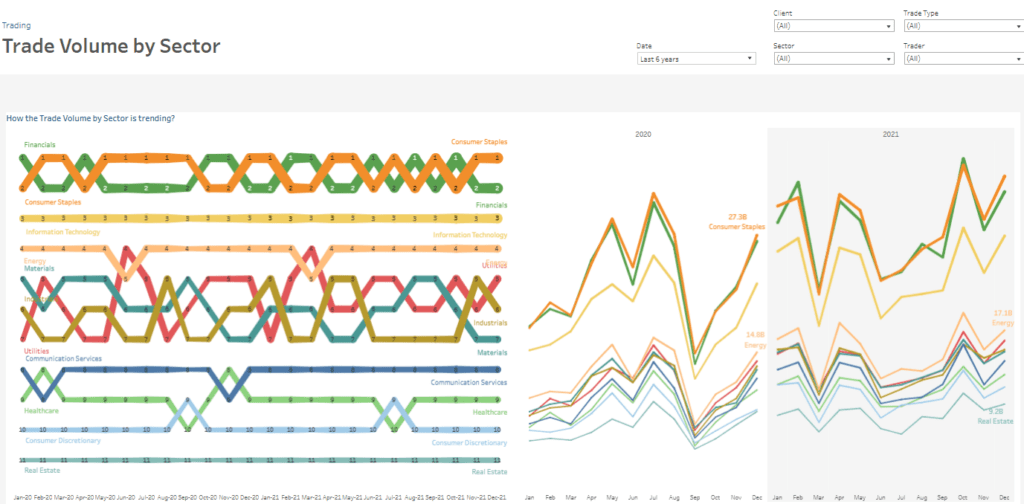
Thedashboard incorporates two primary chart types to visualize the data. A ranked line chart tracks the ranking of each sector over time, illustrating shifts in sector dominance. Additionally, a line graph plots the actual trade volume for each industry over a specified period, highlighting fluctuations and trends. These visualizations provide relative and absolute insights into sector performance, helping users identify which sectors are gaining momentum and which are declining.
This dashboard is especially beneficial for financial analysts, portfolio managers, and decision-makers within trading firms. By examining trade volume trends across sectors, users can uncover opportunities, monitor sector performance, and make informed decisions to refine their trading strategies. Trading dashboards like this enable users to align their investments with current market dynamics, seize emerging opportunities, and maintain a competitive advantage in a fast-paced trading environment.
# 7 Trading Dashboard – Potential New Revenues
Thisdashboard focuses on potential new revenues, analyzing trade volumes that currently generate no commission and estimating the additional revenue that could be achieved by applying a commission. Key metrics displayed include total trade volume ($4,319.9B), the number of trades (937,102), and trade volume and trades without commission ($51.3B and 11,339, respectively). The dashboard calculates the potential revenue increase based on adjustable commission rates, showcasing the impact on current and new revenues.
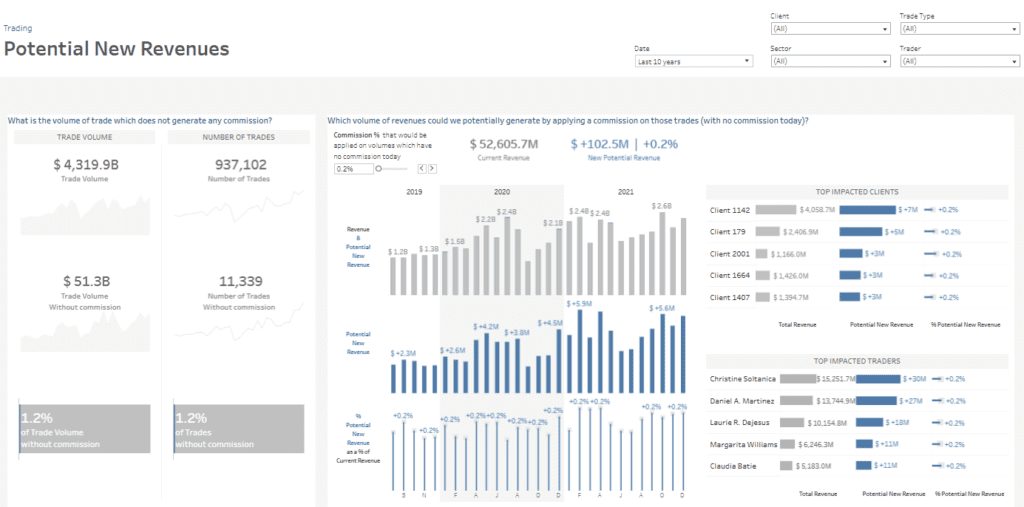
The dashboard effectively presents data using multiple chart types. Bar charts show trends in current revenue, potential new revenue, and the percentage increase over the past years, providing a clear view of revenue opportunities. Horizontal bar charts highlight the top-impacted clients and traders, illustrating their total revenue and potential new revenue contributions. Line charts display trends in trade volume and the number of trades without commission over time, helping users identify patterns.
This trading dashboard is particularly valuable for financial analysts, revenue strategists, and decision-makers in trading firms. It helps them identify untapped revenue streams, assess the economic impact of applying commissions, and target key clients and traders for optimization. Trading dashboards like this enable informed decisions to maximize profitability and revenue growth opportunities.
# 8 Trading Dashboard – KPIS Performance
Thisdashboard focuses on KPI performance and trends, providing a detailed view of trade volume metrics and their progression over time. It highlights the total trade volume for the year-to-date, amounting to $2,119.9B, and compares it to the previous year, showing a 24.7% increase. Monthly performance trends are visualized, enabling users to track growth and identify periods of significant activity.
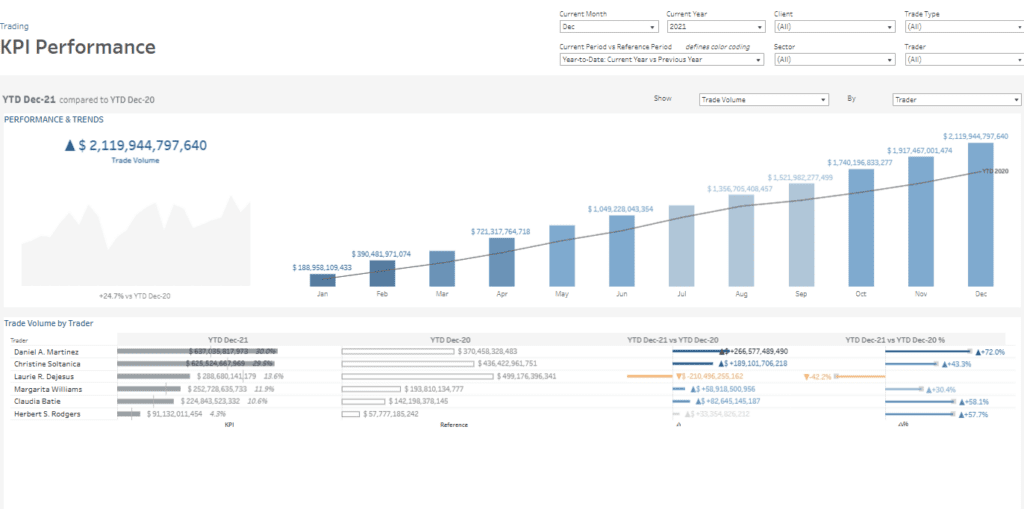
The trading dashboard includes two primary chart types. A bar chart displays cumulative monthly trade volumes, clearly visualising performance trends and comparisons to the previous year’s benchmarks. A horizontal bar chart breaks down trade volumes by individual traders, showcasing year-to-date data, prior-year comparisons, and percentage changes. This detailed breakdown identifies top-performing traders and highlights significant fluctuations in performance.
This trading dashboard is valuable for trading managers, analysts, and executives who need to monitor performance at both strategic and operational levels. By offering insights into trade volume growth and individual trader contributions, stakeholders can evaluate overall business health, reward high performers, and identify improvement opportunities. Trading dashboards like this enable data-driven decision-making, better resource allocation, and improved operational efficiency in competitive trading environments.
# 9 Trading Dashboard – Adhoc
This trading dashboard provides an in-depth analysis of trade volume trends, trader performance, and Pareto analysis, offering a detailed view of trading activity over time. It displays year-over-year trade volume trends, segmented by months and years, enabling users to monitor fluctuations and growth patterns. Additionally, it includes a breakdown of trade volume by individual traders, highlighting their contributions to overall trade volume.
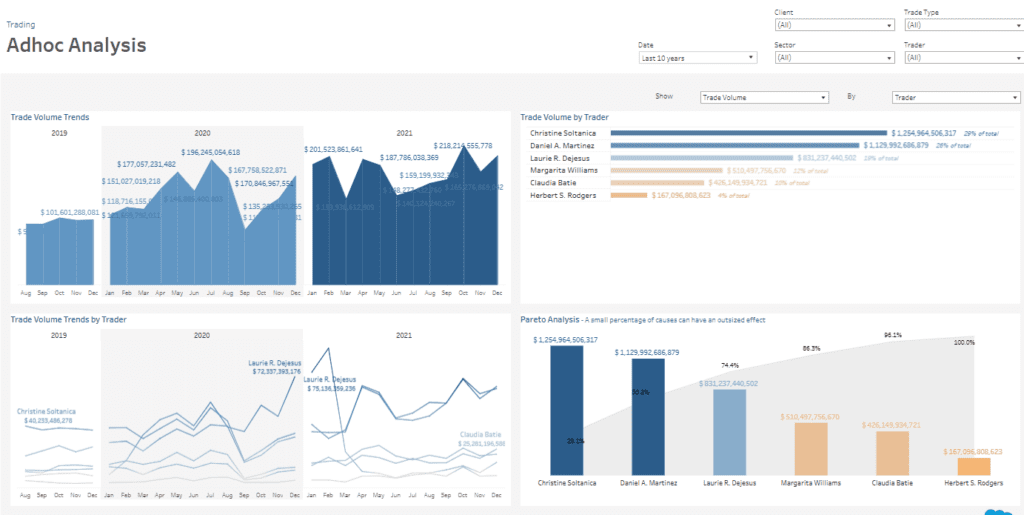
The trading dashboard utilises various chart types to present data effectively. Bar charts showcase total monthly trade volumes across multiple years, clearly reflecting seasonal trends and year-on-year comparisons. Line charts illustrate trade volume trends by individual traders, helping users identify performance trajectories and key contributors. Horizontal bar charts rank traders based on their total trade volumes, emphasizing their percentage contributions to overall results. A Pareto chart further highlights the 80/20 rule, revealing how a small group of traders account for most of the trade volume and spotlight critical players in the trading landscape.
This trading dashboard is valuable for trading managers, financial analysts, and decision-makers. It provides actionable insights to monitor trends, evaluate trader performance, and optimize strategies to maximize impact and efficiency.
The nine trading dashboards featured in this post showcase the many ways data visualization can elevate trading operations. From monitoring KPIs and sector trends to assessing trader contributions and identifying potential new revenue streams, these dashboards for trading offer actionable insights that drive better decision-making and boost profitability. Integrating a trading dashboard into your workflow can give your team a competitive advantage, enabling them to make informed decisions and respond effectively to market dynamics. Use these examples as inspiration to design or enhance your trading dashboards and empower your team to achieve tremendous success in the ever-evolving financial landscape.