
Looking to find the best Tableau sales dashboard to tackle one of your business problems? Look no further!
What is a Tableau Sales Dashboard?
Imagine having the power to access and visualize your sales and marketing data at your fingertips!
A Tableau sales dashboard lets you track your sales performance in real time. A sales dashboard lets you gain valuable insights to make informed decisions quickly.
It’s like having your very own personal sales assistant. They will give a bird’s eye view of your sales metrics.
A Tableau sales dashboard is an indispensable tool to help you take your business to the next level!
Are you ready to supercharge your sales game and hit those targets like a pro? The first step is to determine which sales metrics you’ll track!
Who Will Use Your Tableau Sales Dashboard?
The key to success is identifying who will use your Tableau sales dashboard.
We need to consider the unique needs and preferences of your team.
Are you a sales rep looking to track their progress toward their monthly quota?
Or are you a sales manager more interested in seeing the top-performing reps for the quarter?
Are you a CEO wanting a bird’s eye view of an entire sales organization?
‘Who’ will use the sales dashboard ensures it fulfils its purpose.
Examples of Tableau Sales Dashboards
A Dashboard to Set and Monitor Annual Sales Targets
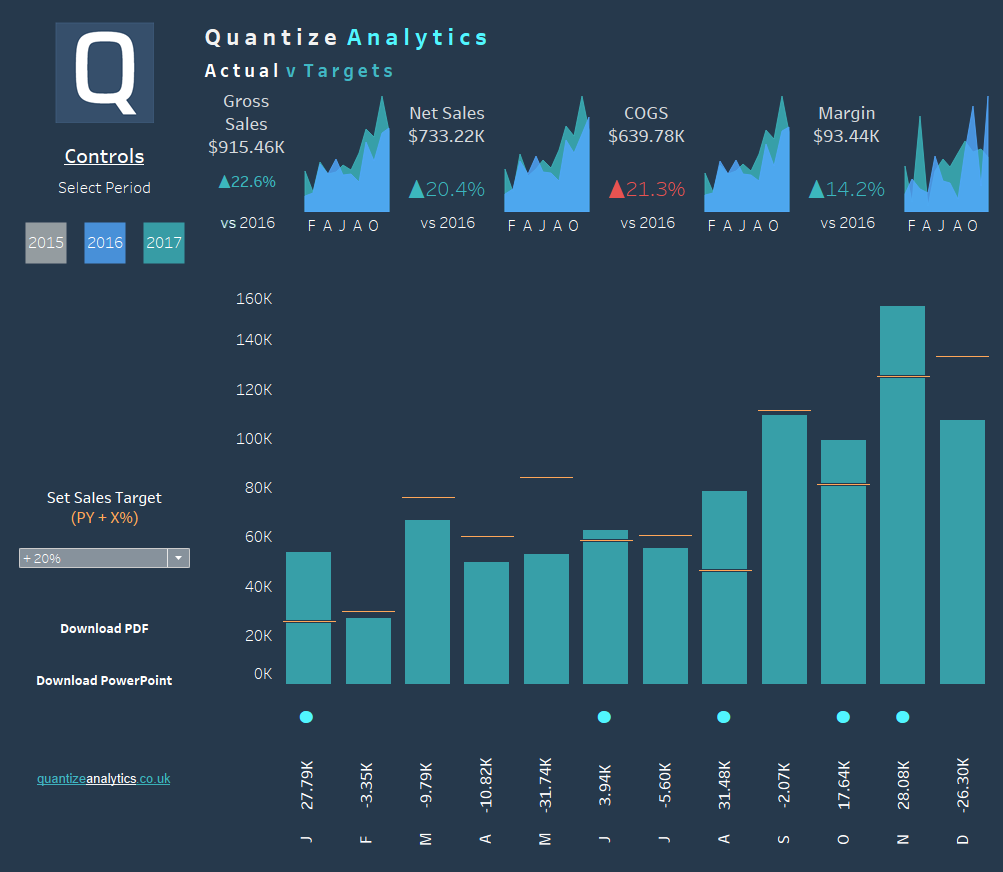
Here, we have a Tableau sales performance dashboard to help set monthly sales targets based on a percentage increase from the previous year’s sales value. Your team can use a dashboard for the following reasons:
- Sales targets provide direction and purpose for the sales team.
- They measure performance and identify areas for improvement.
- Sales targets help prioritize activities and allocate resources.
- They foster accountability and ownership among sales representatives.
- Monitoring targets allows for the evaluation and adjustment of sales strategies.
- Achieving targets boosts morale and motivates the sales team.
- Sales targets support planning, budgeting, and resource allocation.
- They create a framework for recognizing and rewarding outstanding performance.
- Regular monitoring ensures timely adjustments and adaptability to market changes.
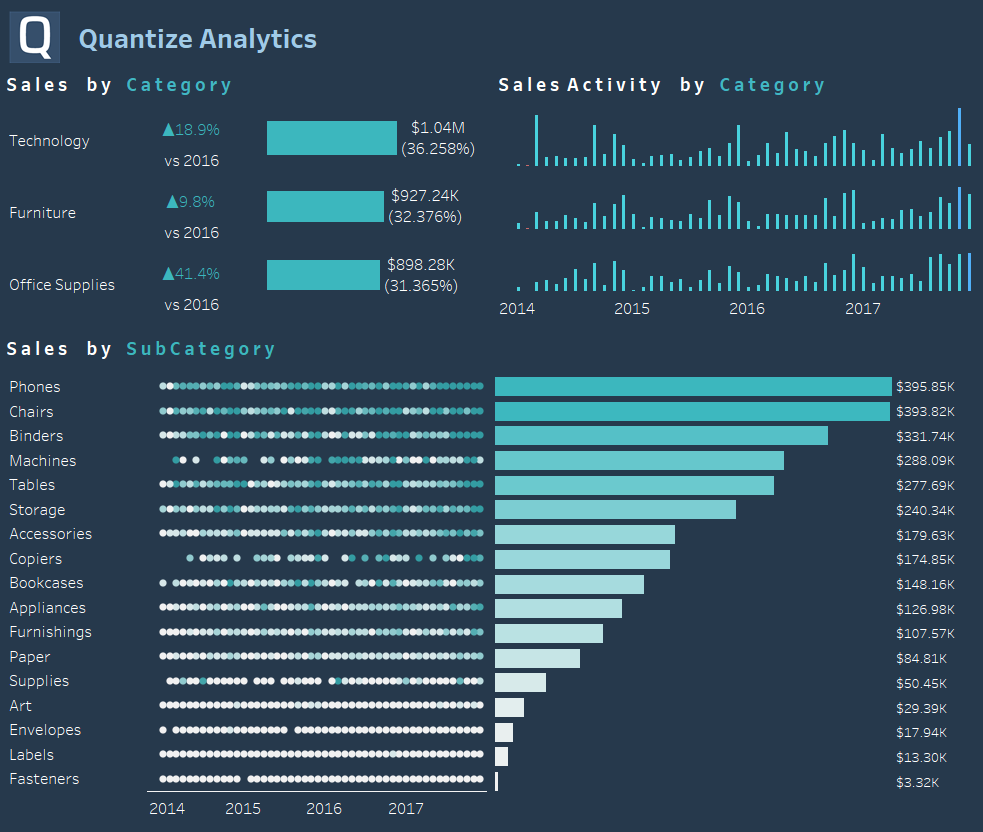
Tableau Sales Dashboard By Product Category
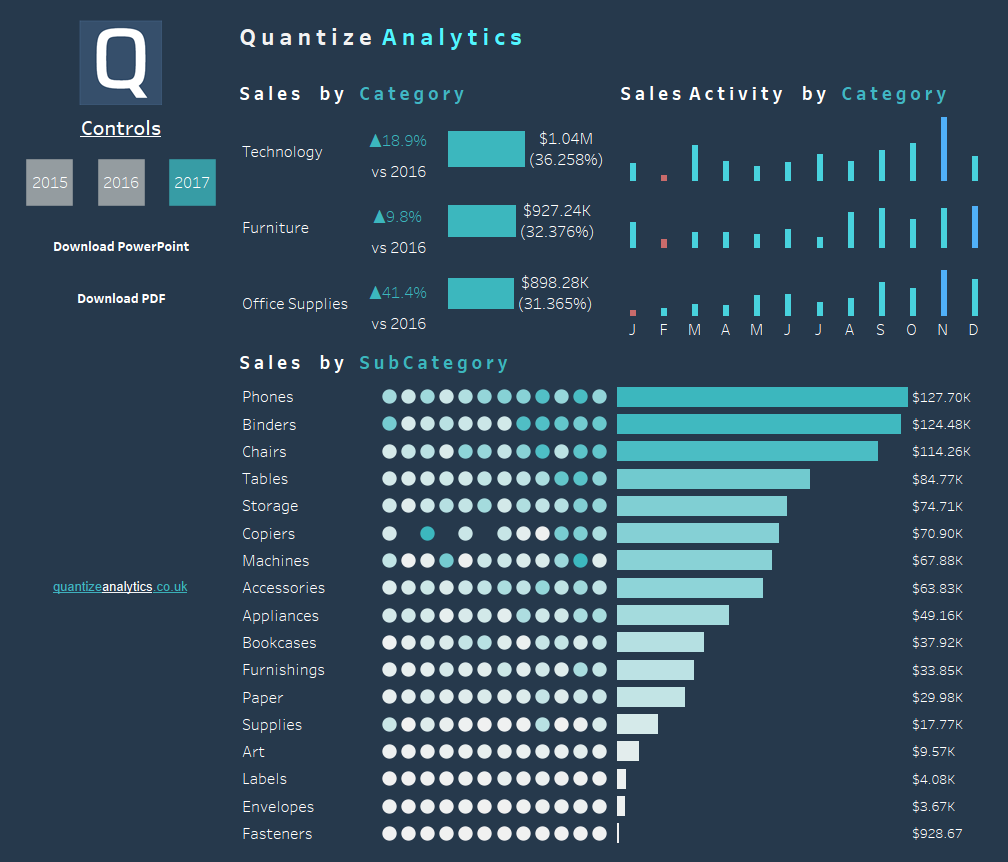
The sales analysis dashboard above shows sales by product category and subcategory. This allows the user to view which product categories are selling well. It also shows what months of the year are the best time for sales.
- The sales dashboard shows sales performance by product category.
- Helps identify high-performing product categories.
- Enables focus on promoting and selling those products.
- Tracks trends and patterns in category sales.
- Prompts action for improving underperforming categories.
- Compares category performance over time.
- Analyzes profitability of different categories.
- Tracks individual sales performance within categories.
- Facilitates communication and collaboration with managers.
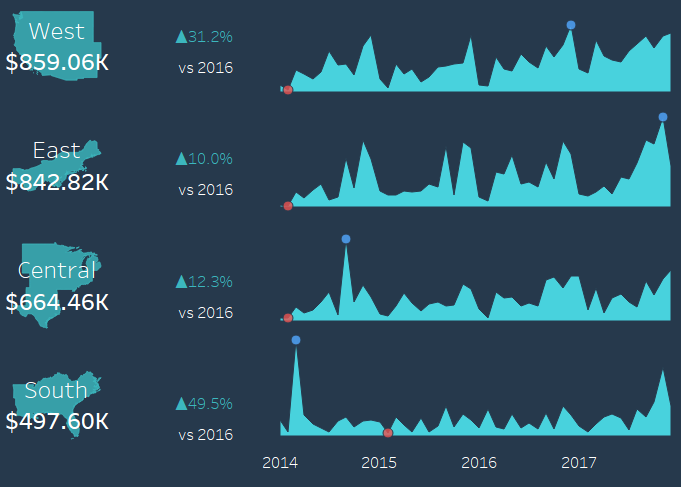
Tableau Sales Dashboard by Region
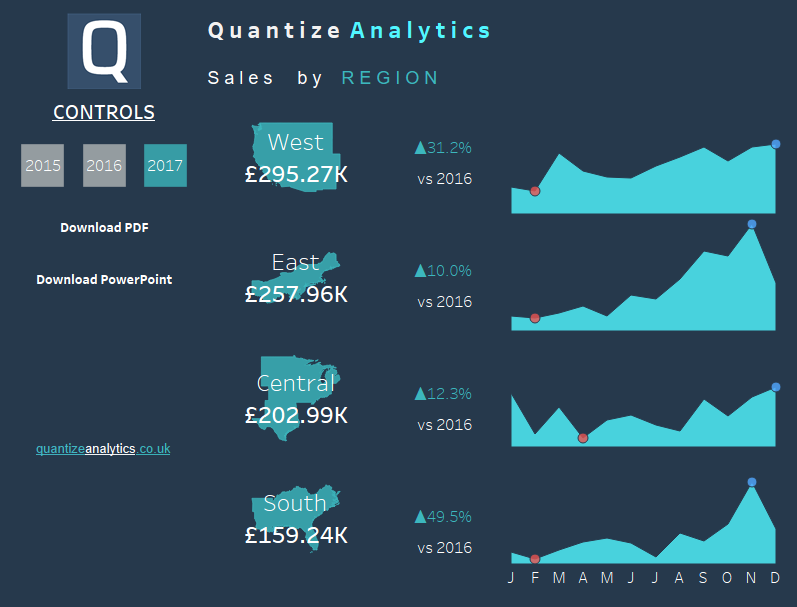
Above, we have a dashboard showing sales performance by region. A region is made up of individual states.
- The sales dashboard shows sales performance by region.
- Helps identify high-performing regions.
- Enables focus on regions with the most significant sales potential.
- Tracks trends and patterns in regional sales.
- Prompts action for improving sales in the underperforming region
- Compares sales performance across different areas.
- Analyzes profitability of sales in different regions.
- Tracks individual sales performance within each region.
- Facilitates communication and collaboration with colleagues and managers.
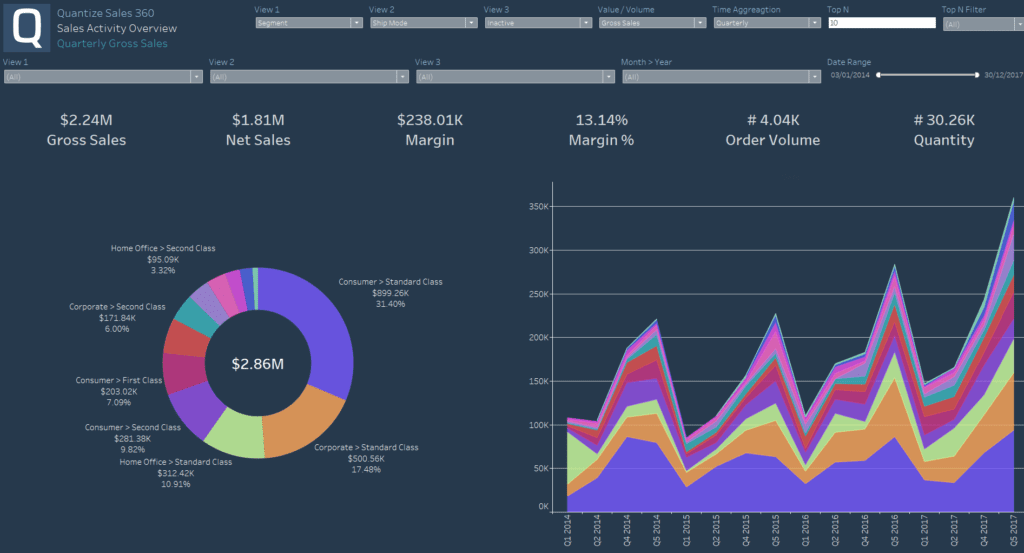
Tableau Profitability Dashboard By Product
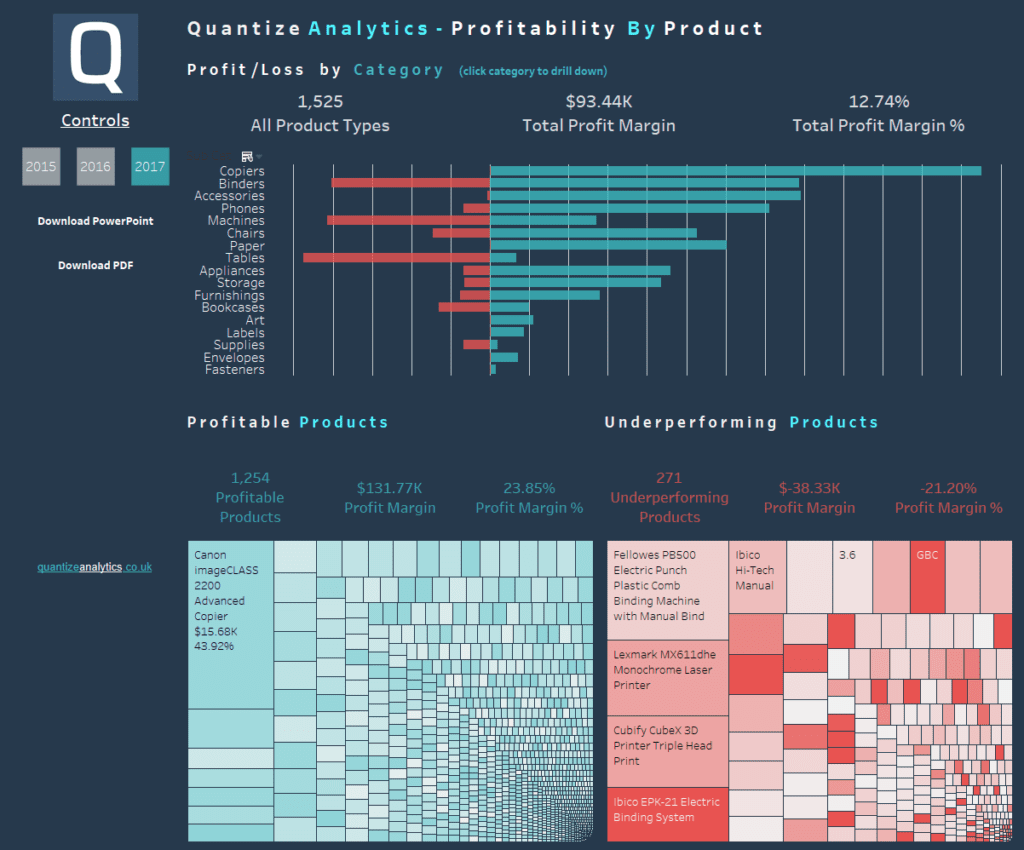
In the above dashboard, we see profitability by product.
This dashboard gives us insight into which products are profitable. Also, we can see which products detract from net profit. It gives insights into which categories of products are profitable in aggregate. We can increase net profit if we can identify unprofitable products and cut them.
- The product profitability dashboard provides insights into the financial performance of each product.
- Helps identify high-profit products and prioritize resource allocation.
- Enables analysis of product margins, costs, and revenue.
- Guides strategic decision-making for product development and pricing.
- Identifies underperforming products that require improvement or phase-out.
- Enables tracking of profitability trends over time.
- Supports evaluation of marketing campaigns’ impact on product profitability.
- Facilitates comparisons between different product lines or versions.
- Provides data for effective budgeting and forecasting.
- Assists in setting profitability targets and monitoring progress.
Sales Dashboard by Gender, Age and Location
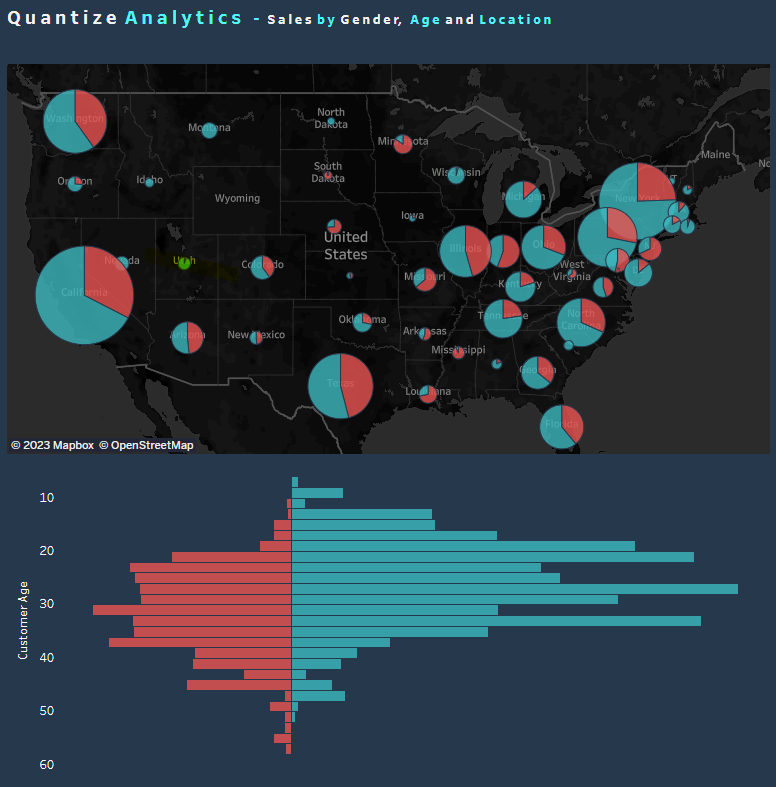
Here is a simple Tableau sales dashboard that shows the impact of customer attributes like gender, age, and location on sales. This dashboard allows users to drill down into factors that may impact sales quickly. If your data does not have the customer’s gender, this information can generally be inferred from their name using customer data enrichment processes.
- The sales dashboard provides insights into sales based on gender, location, and age.
- Helps identify target demographics for effective marketing campaigns.
- Enables segmentation of customer base for personalized messaging.
- Allows marketers to tailor marketing strategies based on demographic preferences.
- Provides data on sales performance across different genders, locations, and age groups.
- It helps identify trends and patterns in purchasing behaviour among specific demographics.
- Assists in evaluating the effectiveness of marketing efforts in targeting specific demographics.
- Enables identification of untapped market segments for potential growth opportunities.
- Supports data-driven decision-making for product positioning and targeting.
- Facilitates optimization of marketing budget allocation by focusing on high-potential demographics.
Customer Segmentation Dashboard
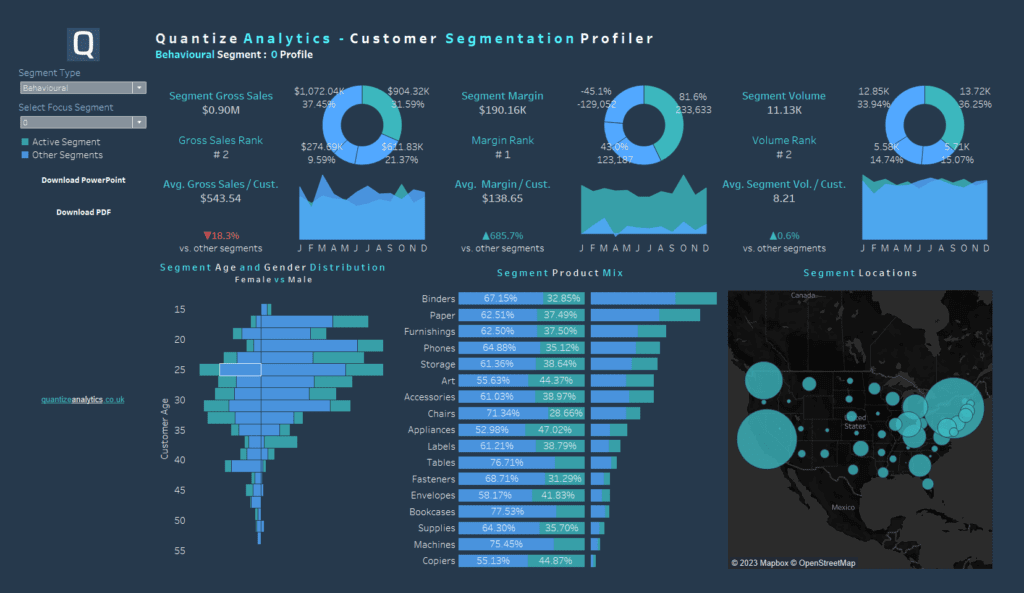
Above, we have an example of a customer segmentation dashboard. We can compare the focus customer segments in green to other segments in blue to get an understanding of each segment’s attributes compared to other segments. For example, various lenses we can look at the segmentation include gross sales profit, volume, age, and gender distributions. Lastly, we can look at segment product mixes and where the segments are located.
- Dashboard profiles customer segments, aiding the marketer’s understanding.
- Identifies distinct customer groups based on demographics and behaviours.
- Analyzes segment size and profitability.
- Reveals specific needs, interests, and pain points of segments.
- Customizes marketing messages for each segment.
- Evaluates marketing effectiveness across segments.
- Uncovers new market opportunities with underserved segments.
- Tracks performance and growth potential of segments.
- Measures customer satisfaction and loyalty within each segment.
- Informs decisions on product, pricing, distribution, and targeting.
Sales Pipeline Dashboard – Open Opportunities

Here, we have a simple sales opportunities dashboard based on sales pipeline data, specifically open opportunities. This shows the available options over time and how far along the sales pipeline the opportunity has progressed.
- The sales pipeline dashboard provides an overview of the sales pipeline.
- Helps track and manage leads and deals at different stages.
- Enables identification of bottlenecks and areas for improvement in the sales process.
- Facilitates forecasting and revenue projections based on pipeline data.
- Assists in setting realistic sales targets and monitoring progress.
- Allows sales managers to allocate resources and prioritize opportunities effectively.
- Provides insights into sales team performance and individual contributions.
- Enables proactive decision-making and intervention to drive deals forward.
- Promotes collaboration and communication within the sales team.
- Supports effective coaching and training by identifying areas of sales pipeline weakness.
Customer Cohort Analysis Dashboard
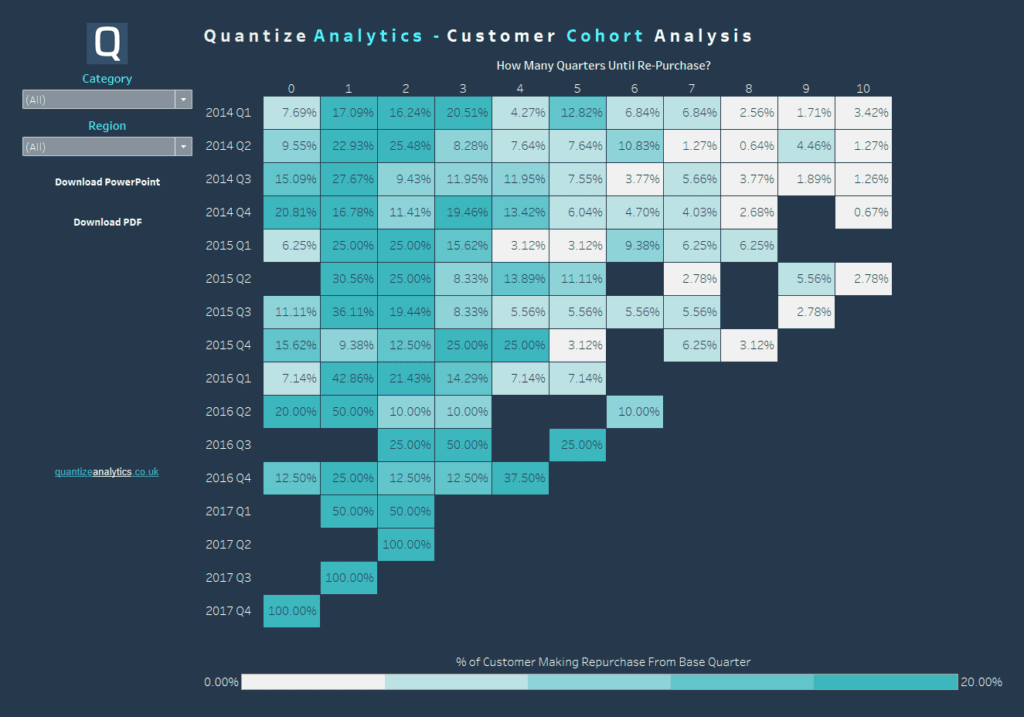
Here, we have a Tableau cohort analysis dashboard. This is an easy way to identify how long customers have taken, in quarters, to return for a repeat purchase. Cohort analytics is an easy way to discover patterns about customers so we can take action to boost profits. For example, if we know most customers return within 3 quarters, we can provide upsell, cross-sell deals, or volume discounts to increase profit when the customer returns.
- The cohort analysis dashboard shows customer re-purchase patterns over time.
- It helps marketers identify customer retention and loyalty trends.
- Enables segmentation of customers based on their re-purchase behaviour.
- Allows marketers to target specific cohorts for tailored marketing campaigns.
- Assists in predicting customer behaviour and future revenue streams.
- Provides insights into the effectiveness of marketing strategies on customer retention.
- Helps identify opportunities to optimize customer lifecycle and increase repeat purchases.
- Facilitates the measurement of customer lifetime value and return on investment.
- Supports data-driven decision-making for marketing budget allocation.
- It enables marketers to refine their strategies and tactics to maximize customer retention.
Customer Churn Dashboard
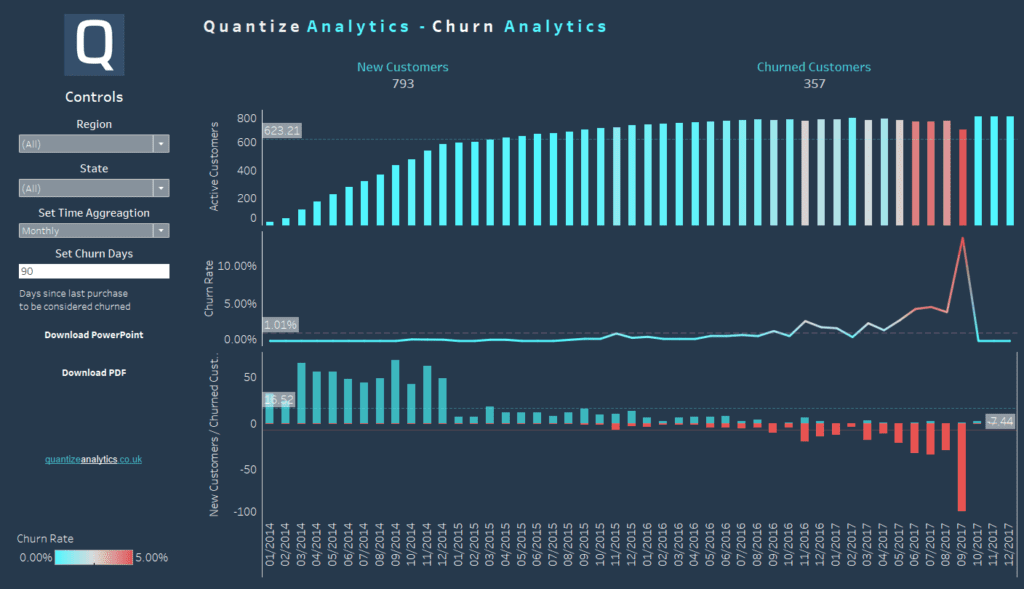
Here, we have a churn analytics dashboard that shows at what rate customers are ending their relationship with a company. We can also see the inflow of new customers and the outflow of existing customers.
- The customer churn dashboard provides an overview of customer attrition rates.
- Helps track and analyze customer churn trends over time.
- Enables identification of factors contributing to customer churn.
- Assists in identifying at-risk customers for targeted retention efforts.
- Provides insights into the effectiveness of customer retention strategies.
- Helps prioritize resources and initiatives to reduce churn and improve customer loyalty.
- Facilitates the measurement of customer lifetime value and revenue impact.
- Supports data-driven decision-making for customer retention strategies.
- Enables evaluation of the impact of marketing campaigns on reducing churn.
- Allows marketers to monitor the success of customer retention initiatives.