“Incoming, we have incoming!” If how to build a radar chart has been on your radar, this tutorial has you covered.
Table of Contents
Data Source to follow radar chart in Tableau tutorial
Please download the following data to follow along with the tutorial
What is a Tableau Radar Chart?
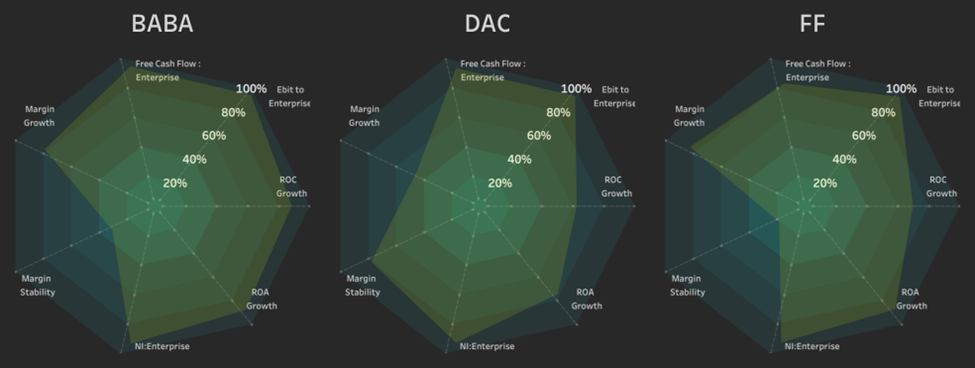
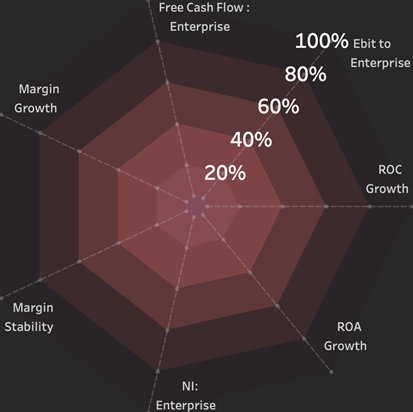
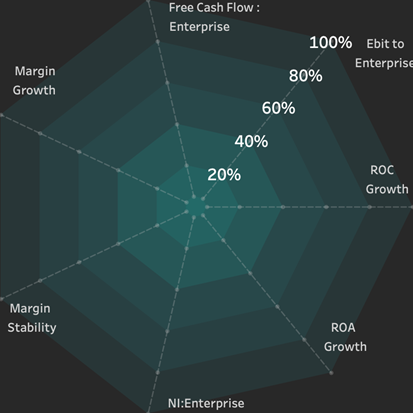
To some, it appears as a radar and, to others, a spider’s web. Essentially, this chart shows quantitative data for different variables or categories. A Tableau Radar chart is excellent for this task because it shows values for various aspects and condenses them in a single chart.
The Tableau radar chart is excellent for visualizing balances or imbalances; for example, the Alibaba stock (BABA) ranks low in margin stability but higher for other ranking criteria.
Where do you start to build a Tableau Radar chart?
Our Tableau Radar chart we will build will use these criteria:
- Net income to enterprise value
- Ebit to enterprise value
- Free cash flow to enterprise value rank
- Return on capital growth rank
- Return on assets growth rank
- Return on assets growth rank
- Margin growth rank
- Margin stability rank
Let’s create the data structure
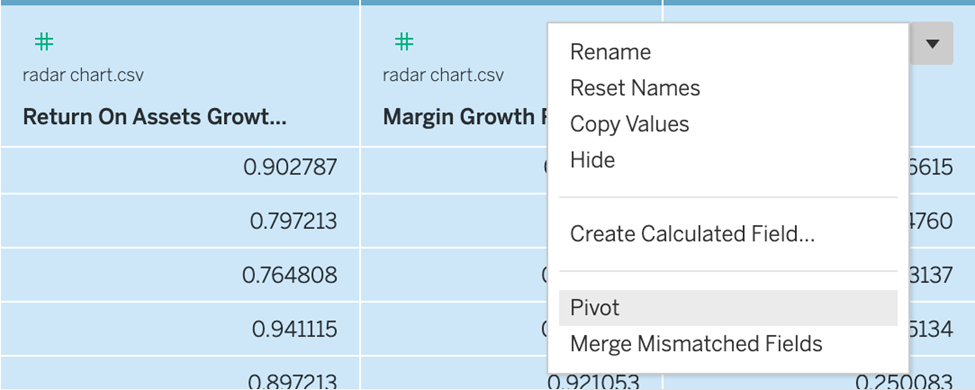
The categories and their values must be nested in their columns as such (i.e., you may need to pivot your data):
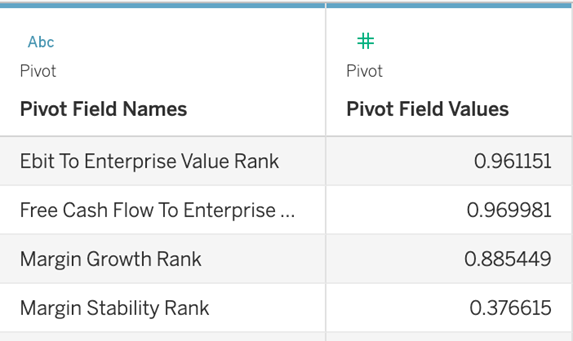
To pivot using a CSV file: Select the first metric, scroll to the right, hold shift, and select the last metric so all metrics are highlighted. Control + Click and select “Pivot”.
Notice that this will create two fields: Pivot Field Names and Pivot Field Measures.
Now, create these fields!
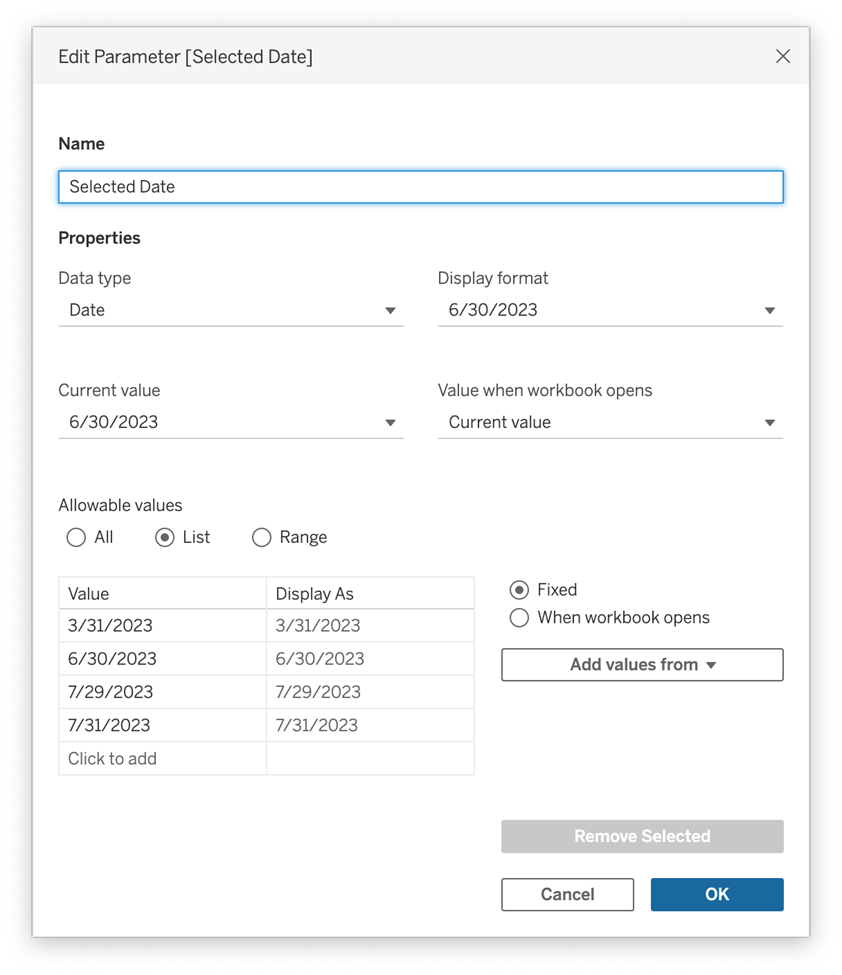
Go into Parameters and edit parameter [selected date].
This parameter will enable you to select a date to update the radar charts. Create a parameter with data type Date. Choose to Add values from DateKey.
Now the Calculated Fields and Index like so.
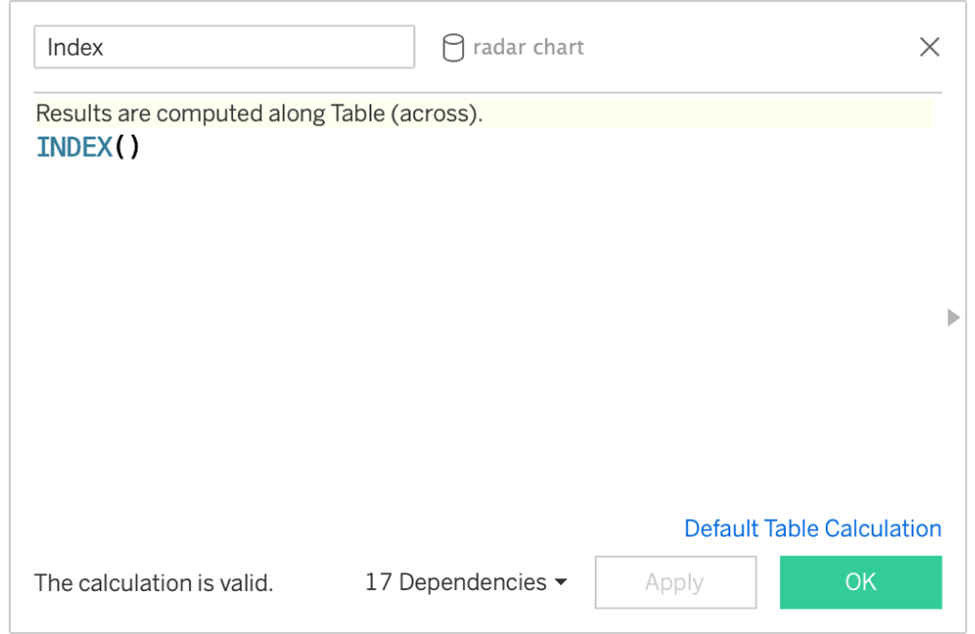
These are used to determine the angular placement for each categorical variable.
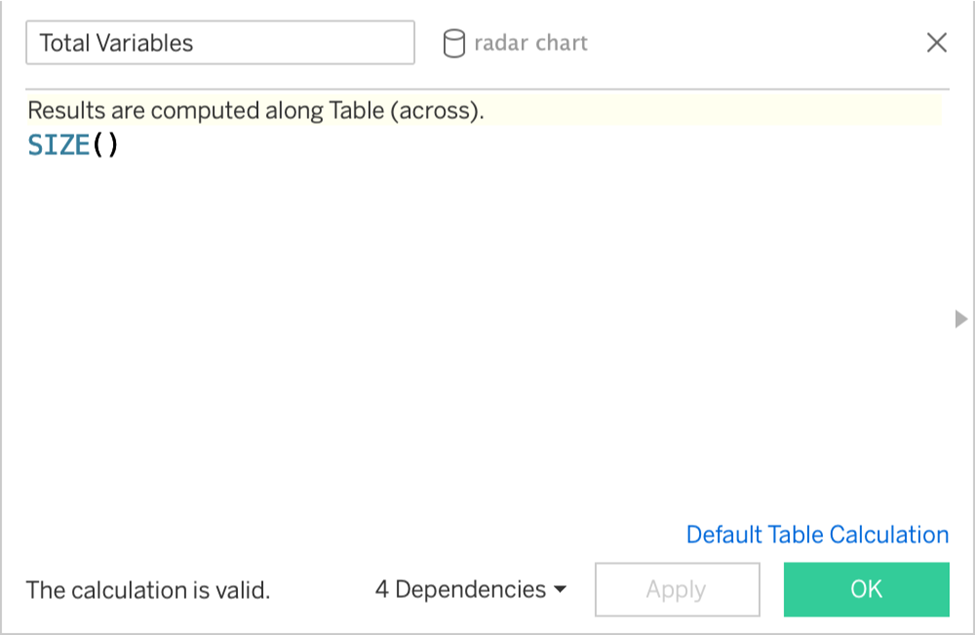
Total Fields Determines the total number of categorical variables in the view. They are used to determine the size of each angle.
Parameterized Variable
Returns the variable according to the selected date. (To control for instances where some categories may not be available for some dates versus others).

Parameterized Value
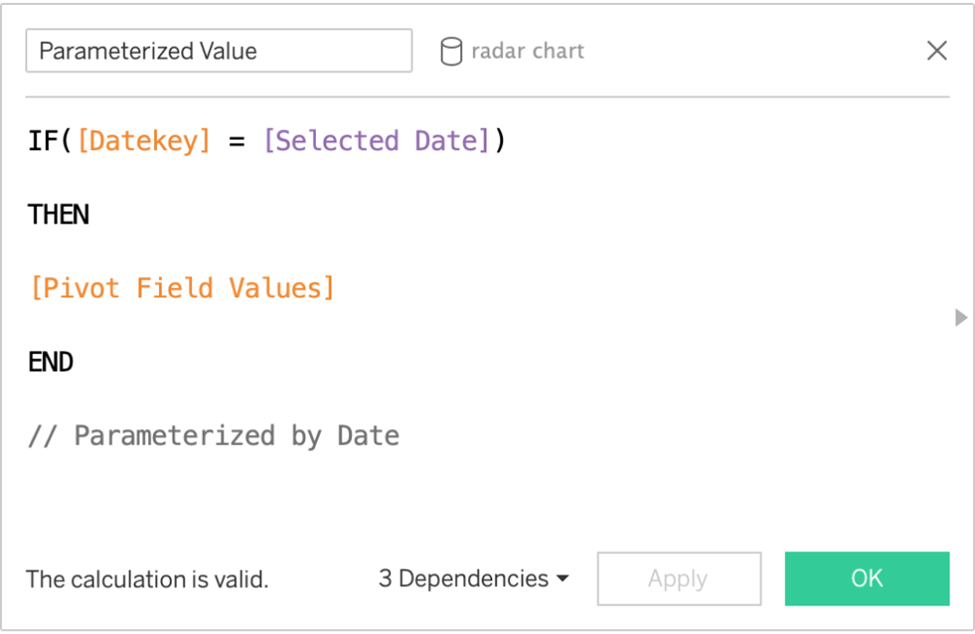
Returns the value according to the selected date.
Angle
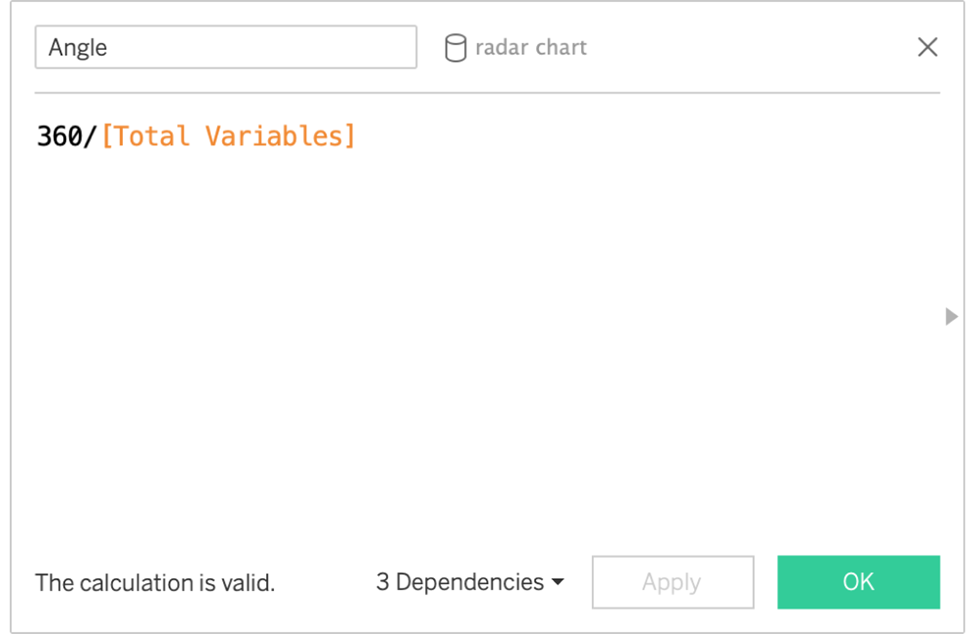
Three hundred sixty degrees divided by total fields computes the size for each angle.
X Trigonometric calculation that uses Cosine to place each value for each categorical variable.
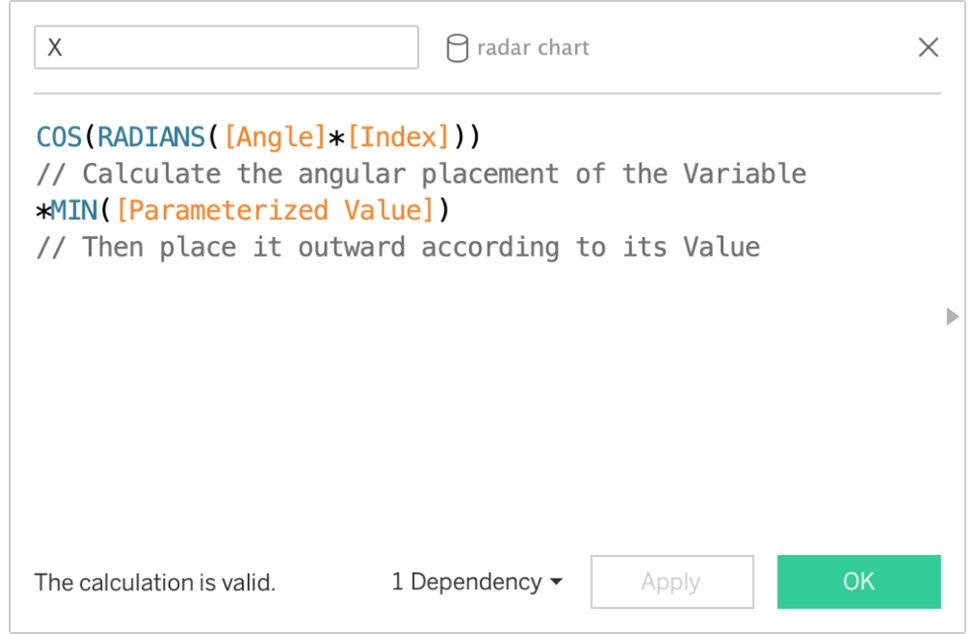
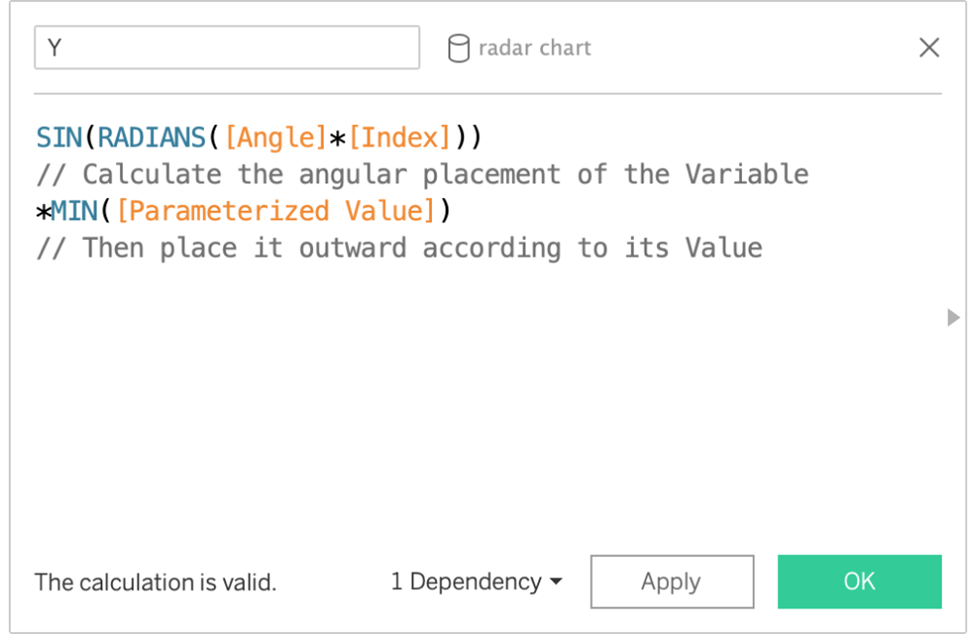
Y
The trigonometric calculation uses Sine to place each value for each categorical variable.
Now, Build the Polygons!
- Drag Ticker to Columns.
- Drag Parameterized Variable to Marks.
- Drag Parameterized Variable to Filter, use an Exclude filter to filter out Null.
- Drag X to Columns. Compute using Parameterized Variable.
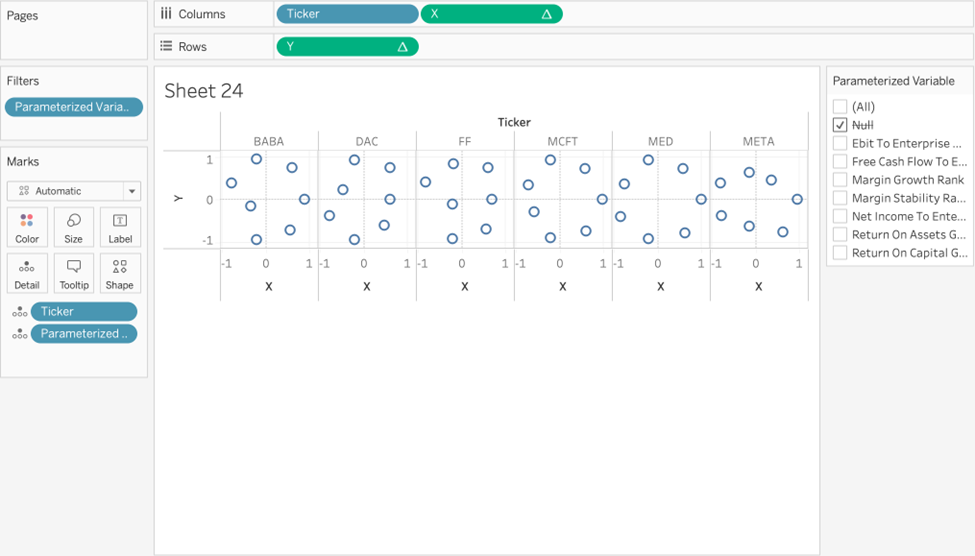
Drag Y to Rows. Compute using Parameterized Variable.
- Change the chart to Polygon on the Marks card.
- Drag Index to path. Compute using Parameterized Variable.
- Also, drag Ticker to Color on the Marks card. Lower the opacity significantly.
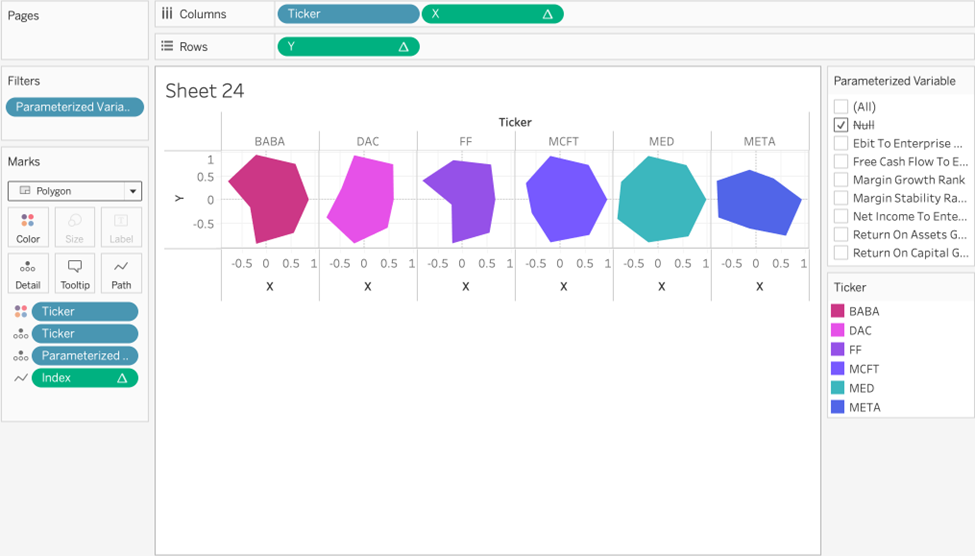
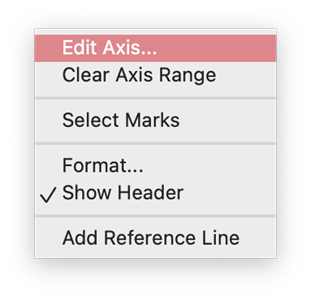
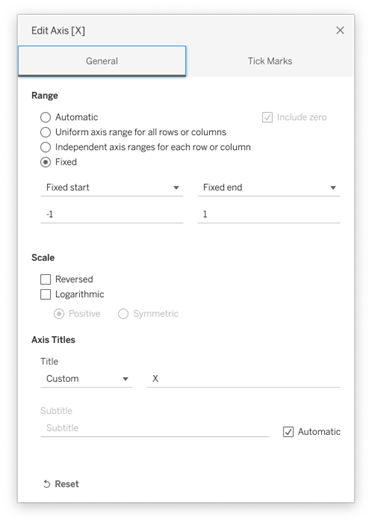
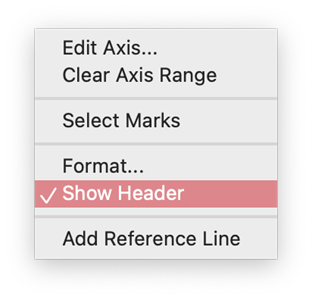
Edit both X and Y axes by right-clicking and selecting Edit Axis. Set Axis range from -1.1 to 1.1 for both axes. Deselect Show Header to hide axes like so;
Now, you need to add a legend or background for the chart. 10. Download any image that can serve as a key and an axis for the variables. Here are two that we created for this tutorial.
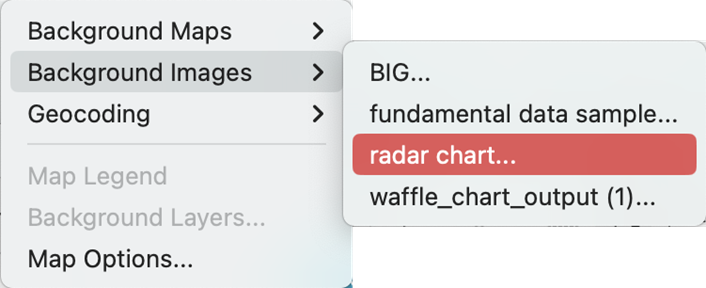
11. After downloading, Import it. On the top toolbar, select Map > Background Images > Radar chart (Or whatever the name of your data source is)
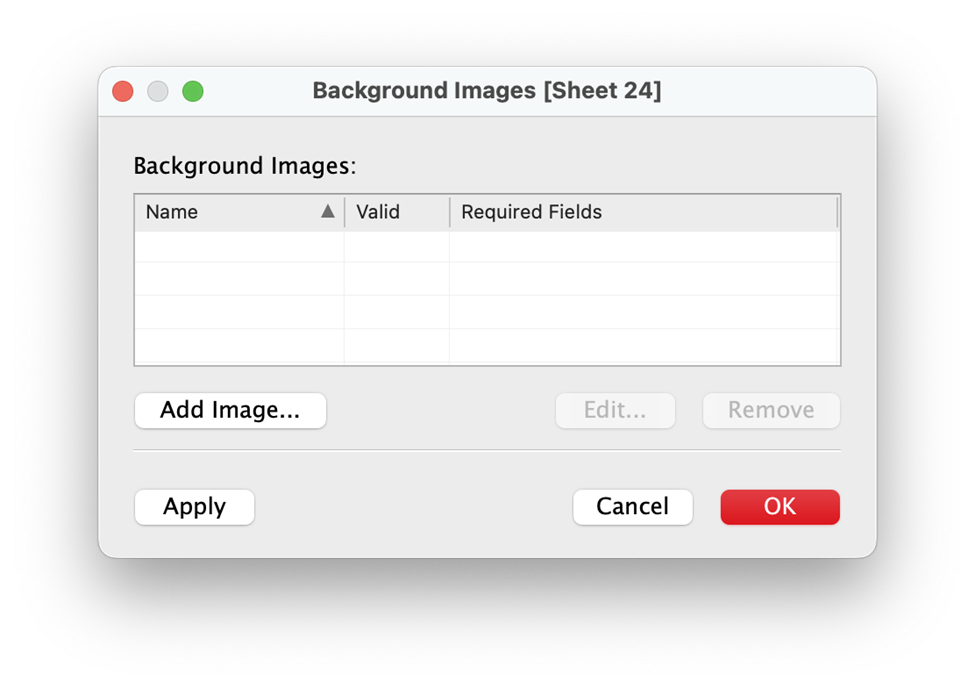
You will see this page:
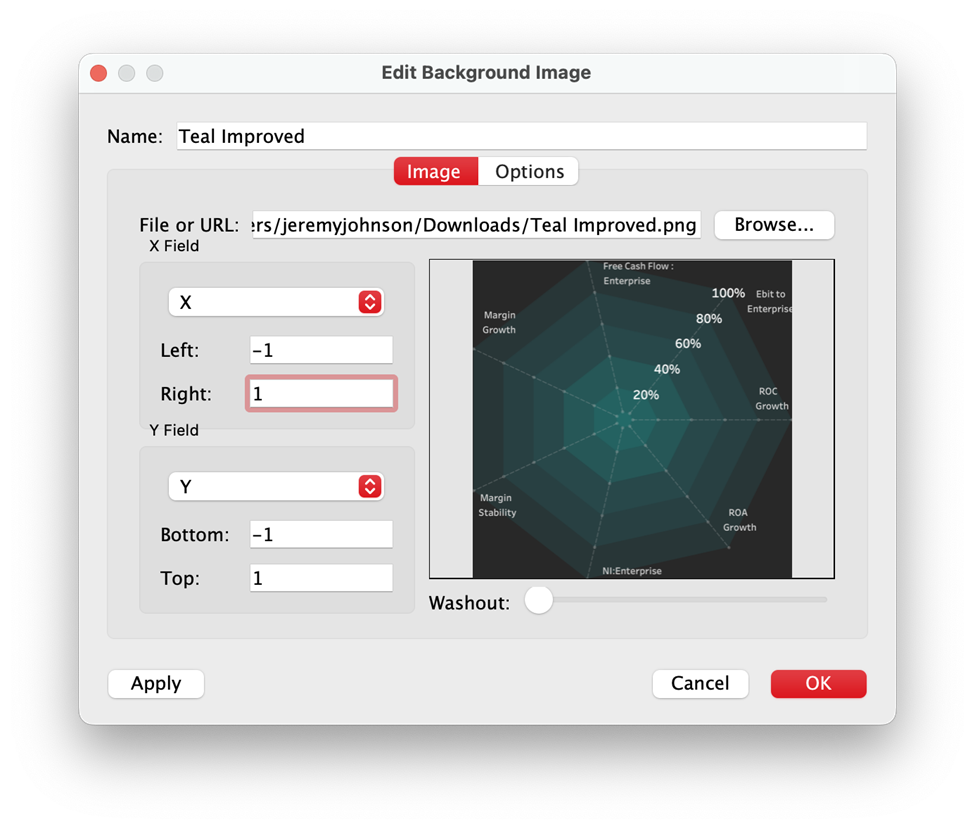
12. Set the image between -1 and 1 for the top, bottom left, and right margins. This will give our charts some breathing room since the axes for our charts are set between -1.1 and 1.1.
CONGRATULATIONS! You now have the Tableau Radar chart.
Now format your Tableau Radar chart for a Cleaner Look
1. Set Background to #282828 to match the background of the radar image.
2. Remove all grid lines, row and column dividers, zero lines, and axis rulers.
3. Increase the font size for Ticker titles and make them light grey.
For more about how to build charts, go to our blog page to explore!
Please let us know if you want to see a tutorial on an advanced Tableau chart we have not covered yet!