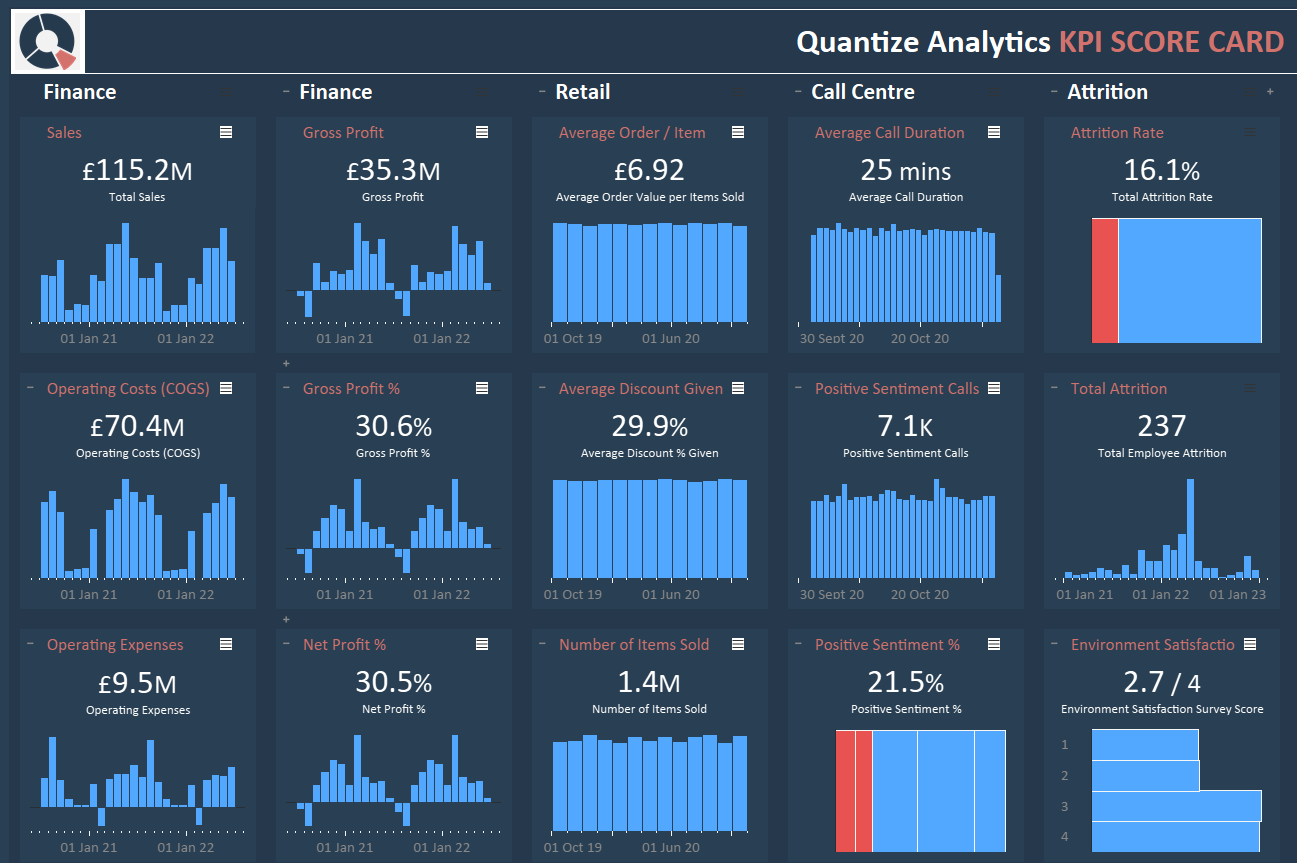
This blog is about a Tableau KPI Dashboard Example. In today’s digital landscape, businesses need agility and informed decision-making based on up-to-the-minute data. Key Performance Indicators (KPIs) are instrumental in assessing a company’s vitality. While raw data is crucial, visualizing this data unlocks its true potential. Here’s where Tableau KPI dashboards make a grand entrance, serving as a dynamic tool for comprehensive business analysis.
Related posts:
- Best 12 Amazing Examples of Tableau Supply Chain Dashboards
- 8 Amazing Tableau eCommerce Dashboard Examples
- Unlock the Power of Tableau Project Management: 7 Inspiring Dashboard Examples
- Unlocking Business Success: 13 Powerful Company Dashboard Examples You Need to See
- Unlock Business Insights: 7 Powerful Tableau Executive Dashboard Examples You Need to See
- 7 Amazing Shipping Dashboards That Will Revolutionize Your Logistics Game

Table of Contents
The saying, “You get what you measure,” highlights KPIs’ role in guiding a business. Every business pursuit, from boosting sales to enhancing customer outreach, stems from set objectives. But merely setting these targets isn’t enough. It’s vital to grasp the route to these goals, identifying the drivers and obstacles of growth.
Tableau KPI dashboards are pivotal in this context. Suppose your aim is a 20% sales uplift. A sales KPI dashboard in Tableau can offer insights on metrics like units sold, revenue, and average order value, among others. Rather than navigating endless data rows, a tableau dashboard KPI visual representation can present both the macro and micro insights promptly.
Advantages of Tableau KPI Dashboards
- Holistic Perspective: Say goodbye to switching between various reports. Witness all pivotal KPIs on a singular tableau KPI dashboard, enabling a comprehensive understanding of metrics interplay and fostering integrated business strategies.
- Timely Monitoring: Tableau dashboards support real-time tracking in our ever-evolving market, keeping you ahead of the curve.
- Trend Detection & Forecasting: Tableau KPI dashboards help identify patterns. Early trend recognition can distinguish between seizing an opportunity and letting it slip.
Crafting Your KPI Dashboard in Tableau
- Initial Step – KPI Selection: Creating a robust tableau KPI dashboard starts with selecting the right KPIs aligned with business goals. If profit growth is your aim, tableau KPI indicators such as total sales, costs, and profit margins are critical.
- KPI Decoded: A Key Performance Indicator (KPI) is a tangible metric gauging alignment with business objectives. Whether evaluating a team, individual, or organization, KPIs in Tableau guide your course.
With data reigning supreme, harnessing it is imperative. Tableau KPI dashboards, from Tableau KPI cards to Tableau KPI charts, are indispensable for businesses eyeing consistent expansion. By offering a lucid performance metrics portrayal, they enable businesses to make educated decisions, guaranteeing a successful and efficient journey toward business aspirations.
Quantize Analytics KPI Dashboard Insights
The Quantize Analytics KPI Dashboard, a stellar tableau KPI dashboard example, offers a panoramic view of essential KPIs across various domains like finance, retail, and call centres. This is a universal KPI dashboard, which means the data source can be easily switched out, so the dashboard does not have to be created from scratch.

Finance KPIs
This section offers insights into the company’s financial standing, from sales trends to profit margins. KPI visualization in Tableau, such as the gross profit percentage, provides an efficient glimpse of product or service generation.
Retail KPIs
Retail KPIs in Tableau showcase the company’s performance, from average order values to the number of items sold, reflecting pricing strategies and demand.
Call Centre KPIs
Tableau dashboard KPI examples from the call centre provide insights into operations, from call durations to customer sentiments.
Attrition KPIs
KPIs centred on employee attrition offer a peek into workforce dynamics and satisfaction levels, from attrition rates to workplace environment scores.
Tableau KPI Dashboard Example Conclusion
In essence, the Quantize Analytics KPI Dashboard, replete with Tableau dashboard KPI examples, is a treasure trove of business insights. It facilitates decision-makers gauging current business standing and strategizing for the future. For more examples of KPI dashboards, see our blog post on eight great examples of KPI dashboards with Tableau, or view our other blog posts.


