Welcome to our Tableau blog series, where we present 13 amazing Tableau financial dashboards. Staying on top of your finances can be overwhelming. Tableau’s dynamic data visualization platform offers the perfect solution.
Our financial experts will guide you through each dashboard’s unique features. We will show how they provide valuable insights from 13 Tableau financial dashboards. These Tableau financial dashboards empower you to take control of your financial destiny.
(These Tableau financial dashboards are from Tableau Public. We do not take credit for any of these dashboards. We want to explore different use cases for finance dashboards in Tableau.)
Disclosure: This post may contain affiliate links. I get a commission if you decide to buy something through my links, at no cost to you.
Also, check out Tableau dashboards for healthcare, marketing, retail and sales.
Table of Contents
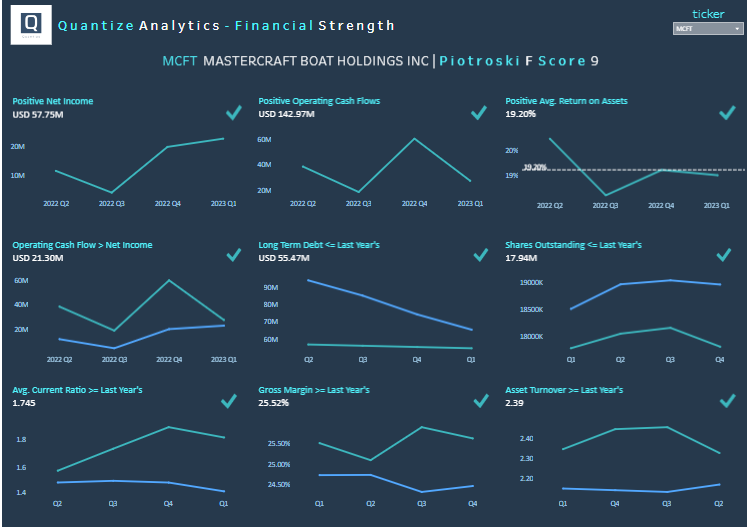
#1 Tableau Financial Dashboards – Assessing Company Strength
Benefits of Tableau Financial Dashboards
- Financial Health Assessment – The Piotroski F-Score dashboard assesses a company’s financial health. The F-score condenses vital financial metrics of profitability, leverage, and operating efficiency. The F-Score condenses complex financial data into a single, digestible score. This empowers users to make faster decisions about potential investments. Or identify strong companies.
- They are identifying strong Investment Opportunities. Investors can use the dashboard to identify stable companies. Stocks with high F-scores are more likely to outperform the market. This makes it a valuable tool for investors seeking long-term growth. As well as value opportunities.
- Risk Management and Due Diligence. The dashboard aids in risk management and due diligence processes. It flags companies with poor financial health. A low F-score may show potential red flags in a company’s financial statements. This prompts investors to conduct a more in-depth investigation before making investment decisions.
Users of Tableau Financial Dashboards
- Investors. Showing the F-Score helps investors assess the financial health of potential investments.
- Financial Analysts. Financial analysts can use the dashboard to perform in-depth company evaluations. They can identify potential red flags or areas of improvement.
- Business Owners. Business owners can gain valuable insights into their company’s financial strength. They identify strategies to enhance their financial position.
Types of Charts
- Positive Net Income: Tracks net income, showing a rise and fall pattern. This which helps in assessing the company’s profitability over time.
- Positive Operating Cash Flows: Indicates operating cash flow trends. This useful for evaluating the cash generated from core business operations.
- Operating Cash Flow > Net Income: Compares operating cash flow with net income. This useful for analyzing the company’s cash efficiency relative to its net earnings.
- Long Term Debt vs Last Year’s: Visualizes changes in long-term debt. This important for assessing the company’s debt management and financial stability.
- Positive Average Return on Assets: This line chart shows the return on assets. This metric evaluates how a company uses its assets to generate earnings.
- Shares Outstanding vs Last Year: Tracks the number of shares outstanding. This provides insights into the company’s stock issuance and buyback activities.
- Average Current Ratio vs Last Year: Illustrates changes in the current ratio. This shows the company’s ability to pay off short-term obligations.
- Gross Margin vs Last Year: Monitors the gross margin trends. This helps with understanding the company’s cost management and pricing strategy effectiveness.
- Asset Turnover vs Last Year: Depicts asset turnover ratio trends. This is key for assessing how a company is utilizing its assets to generate sales.

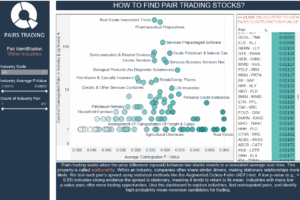
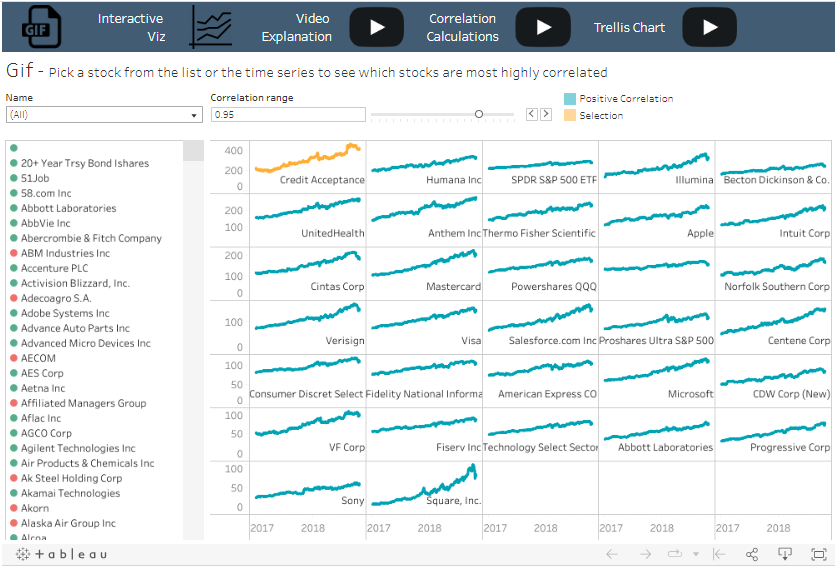
#2 Tableau Financial Dashboards – Stock Correlation
Benefits of Stock Correlation Tableau Financial Dashboards
- Diversification Insights. The equity correlations dashboard provides valuable insights into the relationships between different equities. Investors can use this information to build diversified portfolios. This reduces risk and enhances returns by selecting assets that are not correlated.
- Risk Assessment and Hedging. The dashboard helps assess the risk exposure of a portfolio. Investors identify risk concentrations by understanding how equities move relative to each other. They can create effective hedging strategies to mitigate losses during market downturns.
- Informed Decision-Making. Armed with correlation data, investors can make more informed decisions. They can use low correlations to enhance portfolio stability. They can capitalize on high correlations for specific trading or investment strategies.
Potential Users Stock Correlation Tableau Financial Dashboards
- Traders and Investors. Traders and investors can use the correlations dashboard to identify relationships between stocks. This helps them build diversified portfolios and manage risk.
- Financial Analysts. Financial analysts can use the dashboard to perform in-depth market research. They gain insights into how different stocks move about one another. This assists in making data-driven investment recommendations.
- Portfolio Managers. Portfolio managers can leverage the stock correlation dashboard to optimize their portfolio allocation. This ensures a well-balanced mix of assets and enhances performance.
Type of Charts
The Tableau financial dashboard features a collection of sparkline charts, which are small, simple line charts without axes or coordinates. Sparklines are used to show trends and variations in data over time in a compact format. Each sparkline in the image represents the stock price trend of a different company.
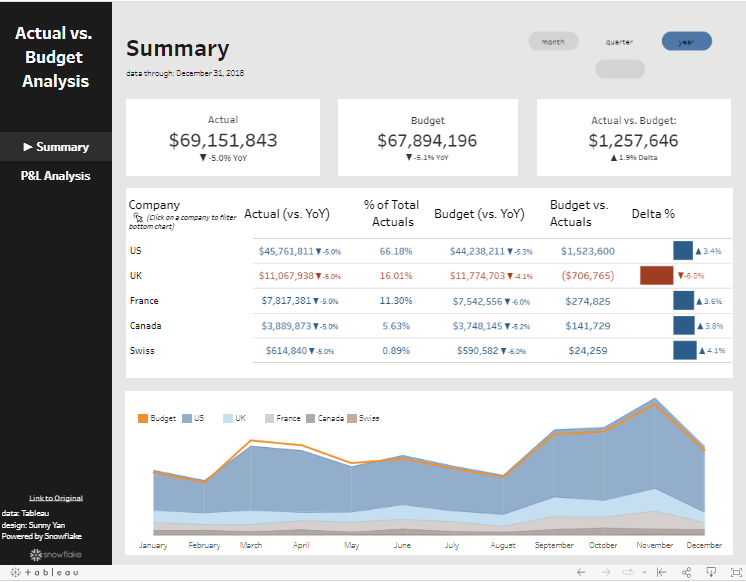
# 3 Tableau Financial Dashboards – Corporate Finance – Actual Versus Budget
Benefits of Corporate Finance Actual Versus Budget Tableau Financial Dashboards
- Performance Evaluation. This Tableau financial dashboard dashboard provides actual revenue compared to the budgeted income. This enables stakeholders to assess performance. This can identify deviations and take corrective actions if necessary.
- Financial Transparency. The dashboard promotes financial transparency within an organization. Team members, managers, and executives have a shared understanding of financial performance. This fosters collaboration and informed decision-making.
- Forecasting and Planning. Businesses can gain valuable insights into revenue trends and patterns. They can use this info for accurate forecasting. This aids in future financial planning. Which helps companies to set realistic revenue targets and budgets.
Potential Users of Corporate Finance Actual Versus Budget Tableau Financial Dashboards
- Business Managers. Business managers can use the dashboard to assess performance against financial targets. This identifies areas of improvement. They can make informed decisions to meet revenue goals.
- Sales Teams. The dashboard provides the sales team with a visual representation of their sales performance. This motivates them to achieve targets and plan sales efforts.
- Finance Departments. Finance departments can use the dashboard to track revenue trends. They can understand budget adherence. Thus gaining insights into the financial health of the organization.
Types of Charts
- Area Chart: The bottom chart shows actual and budgeted financial data over the course of a year. This chart uses different shades of blue to represent actual values. Also, an orange line to represent budgeted values.
- Table with Bar Indicators: In the center there’s a table comparing actual vs. budget values.
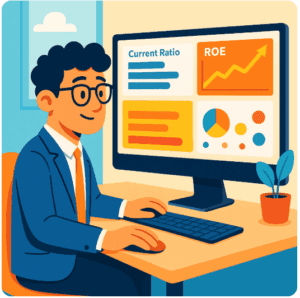
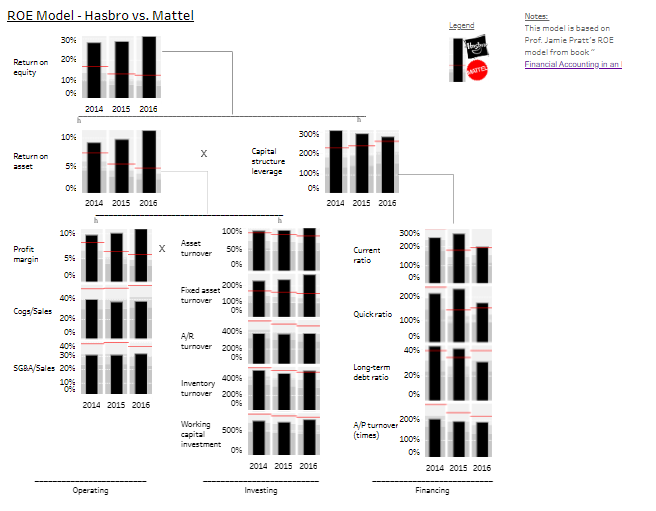
#4 Tableau Financial Dashboards – Financial Ratio Analysis
Benefits of Financial Ratio Tableau Financial Dashboards
- Comprehensive Financial Insights. The dashboard provides a comprehensive view of a company’s financial health. By analyzing various ratios, users can gain insights into performance.
- Efficient Decision-Making. Assess the company strengths to make decisions in budgeting, investment, and risk management.
- Benchmarking and Comparison. The dashboard allows for benchmarking and comparison with industry peers or competitors. Users can assess how the company’s financial ratios stack up against industry standards. This enables them to identify areas where the company excels or lags. This competitive analysis can inform strategic planning.
Potential Users of Financial Ratio Tableau Financial Dashboards
- Shareholders and Investors. Shareholders and investors can leverage the dashboard to display financial ratio analysis. Of particular interest to shareholders is Return on Equity.
- Financial Analysts. Financial analysts can use the dashboard as it provides an overview of a company’s ROE trends. Enabling them to check its financial performance and compare it with industry peers.
- Company Management and Executives. Company management and executives can use the dashboard to watch ROE metrics. They can identify factors influencing profitability. And thus devise strategies to enhance shareholder value and long-term financial sustainability.
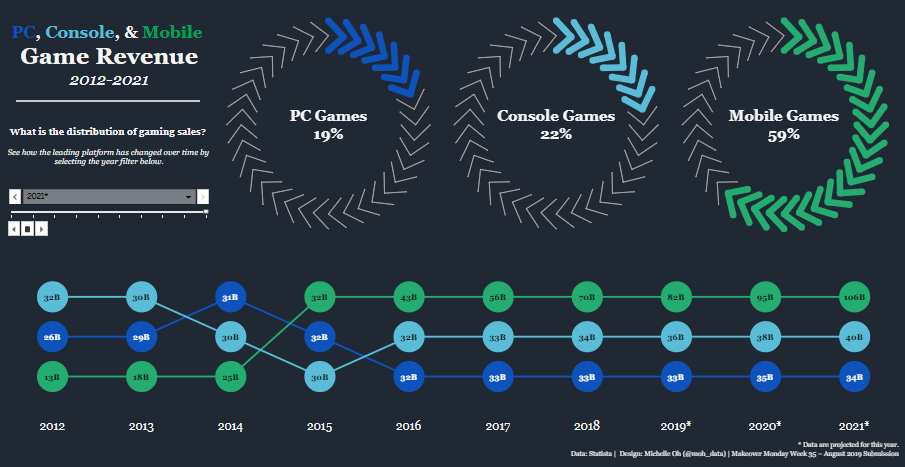
#5 Tableau Financial Dashboards – Revenue Segment Dashboard
Benefits of Tableau Dashboard Dividing Revenue by Segments:
- Enhanced Decision-Making. Provides a clear and concise visualization of income streams. This segmentation allows decision-makers to identify and understand revenue performance across different areas.
- Revenue Optimization. Businesses can divide resources and efforts towards the most profitable segments. This targeted approach enables organizations to optimize revenue generation
- Trend Analysis & Forecasting. Segment-wise revenue data aids in recognizing trends, patterns, and anomalies within specific segments.
Potential Users Revenue Segment Dashboard
- Sales & Marketing Teams. Sales professionals can use the segmented revenue dashboard to analyze sales performance. Marketing teams can leverage this data to refine their campaigns and initiatives.
- Financial Analysts & Strategists. For financial planners the dashboard is a valuable tool for revenue assessment. and strategic formulation. It allows for a deep-dive into revenue, enabling analysts to develop financial strategies.
- Executive Leadership & Management. Senior executives and business leaders need a helicopter view of revenue streams.. This dashboard offers segmented revenue insights. This provides them with a snapshot of financial health across various business segments.

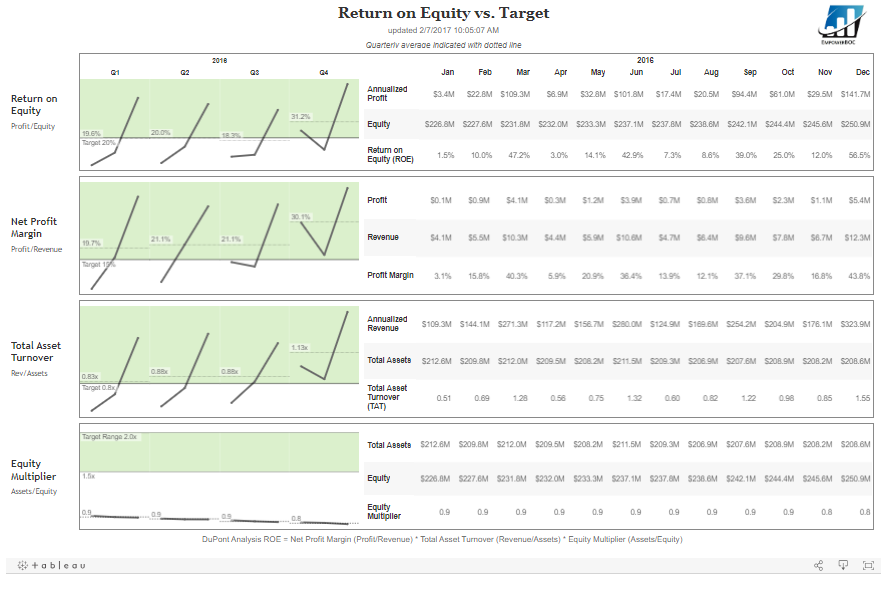
#6 Tableau Financial Dashboards – Return on Equity Versus Target Tableau Dashboard
Benefits of Return on Equity Versus Target Tableau Financial Dashboards:
- Strategic Performance Analysis. ROE Versus Target dashboard offers a way to check the effectiveness of your equity. Users can analyze performance trends, making it a critical decisions.
- Investor Relations Enhancement. With immediate access to ROE against targets, companies can communicate with investors.
- Efficient Resource Allocation. Management can divide resources by understanding how well equity is being used. The dashboard helps identify areas that need improvement.
Potential Users:
- Financial Analysts – Analysts can use the ROE dashboard for financial analysis and performance assessment. It is a tool for evaluating the efficiency of equity use.
- Investor Relations Officers – It allows for transparent sharing of crucial financial performance metrics
- Executive Leadership & Strategy Team. Senior executives use the ROE dashboard as a compass for strategic decision-making. With insights into the company’s equity performance leaders can make informed decisions.
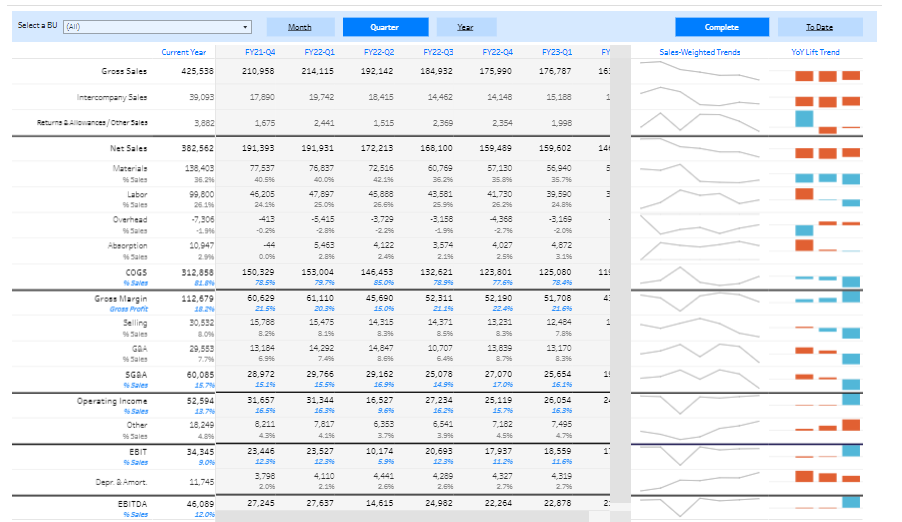
#8 Tableau Financial Dashboards – Margin Analysis Tableau Dashboard
Benefits of Margin Analysis Tableau Financial Dashboards:
- In-Depth Profitability Insight. The Margin Analysis Dashboard in Tableau illuminates the profitability of your products, services, or business units by visualizing margins in an accessible way. It provides a granular understanding of where you’re earning or losing money, aiding in identifying profitable areas and those that need improvement.
- Strategic Pricing Decisions. With instant visibility into various margins, businesses can make informed, strategic pricing decisions. The dashboard allows you to analyze and compare the profitability of different segments, facilitating the development of pricing strategies that enhance overall profitability.
- Cost Management & Optimization. The dashboard provides a clear picture of the cost structure relative to revenues, supporting efficient cost management and optimization strategies. By understanding the components affecting your margins, you can implement initiatives to control costs effectively, boosting your bottom line.
Potential Users:
- Finance & Accounting Professionals. Individuals in finance and accounting can leverage the Margin Analysis dashboard to evaluate revenue streams, costs, and profitability. It’s an essential tool for financial reporting, budgeting, and planning, helping to craft strategies that enhance the company’s financial health.
- Sales & Marketing Teams. Sales and Marketing personnel can utilize the dashboard to understand the profitability of various products, services, or customer segments. This insight is crucial for developing and adjusting sales strategies and marketing campaigns to focus on the most profitable areas, optimizing return on investment.
- Business Owners & Executives. The Margin Analysis Dashboard is invaluable for owners and top executives who need a holistic view of the company’s profitability. It supports informed decision-making and strategy formulation, clearly understanding which business areas drive profit and which need restructuring or improvement.
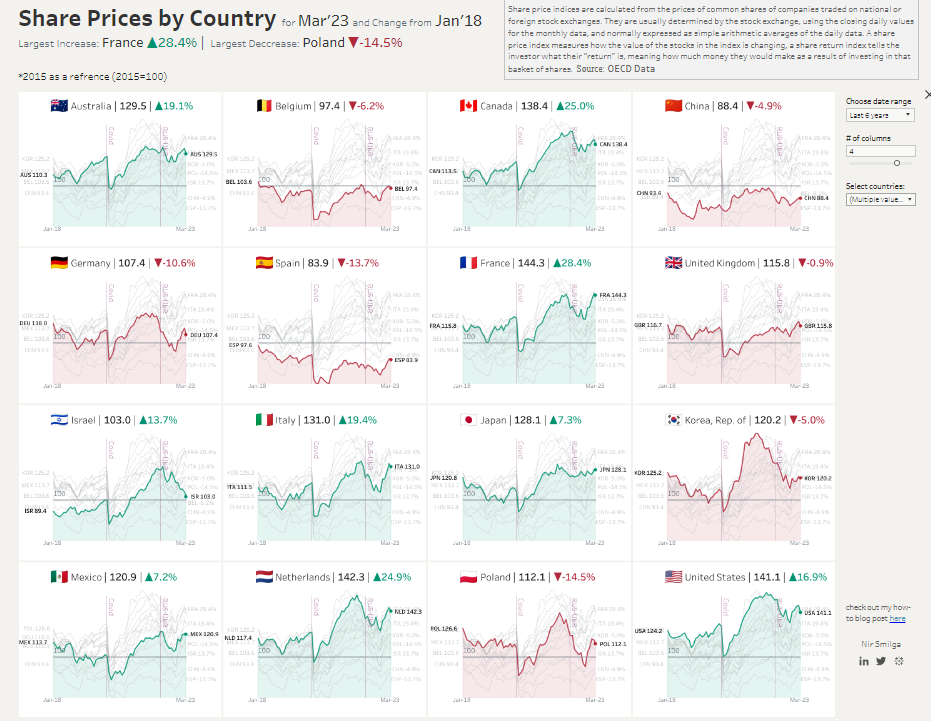
#8 Tableau Financial Dashboards – Share Prices By Country Tableau Dashboard
Benefits of Share Prices By Country Tableau Financial Dashboards:
- Global Investment Oversight. The Share Prices By Country Dashboard provides investors with analysis of equity markets. This enables quick comparison of share prices across different countries. This global perspective supports informed international investment strategies. .
- Risk Mitigation & Diversification. Users can assess and compare market risks in various countries. This ensures the development of a diversified investment portfolio. This dashboard is a crucial risk mitigation tool. It helps investors navigate volatile international markets with data-driven confidence.
- Real-Time Market Analysis. The financial dashboard allows instantaneous market analysis with real-time data visualisation. This provides up-to-the-minute insights into share price movements and market dynamics. This feature helps make timely investment decisions and responding to emerging market opportunities.
Potential Users:
- Investment Analysts & Financial Advisors: They use the dashboard to conduct international market analysis. It’s indispensable for investment recommendations and advising clients on global investment opportunities.
- Portfolio Managers. Portfolio managers can leverage this dashboard to check and manage international investments.
- Institutional & Individual Investors. Both will find this dashboard invaluable. It provides a clear, visual representation of global share prices. This supports investors in making educated investment decisions.

Types of Charts
- Line Chart: Each chart features a line that tracks the economic index of the country in the chart. This line shows the fluctuations and trends of the country’s economic index over time.
- Background Comparative Lines: Behind the primary line, fainter lines represent the indices of other countries. This allows viewers to gauge how one country’s economic performance compares with others over the same timeframe.
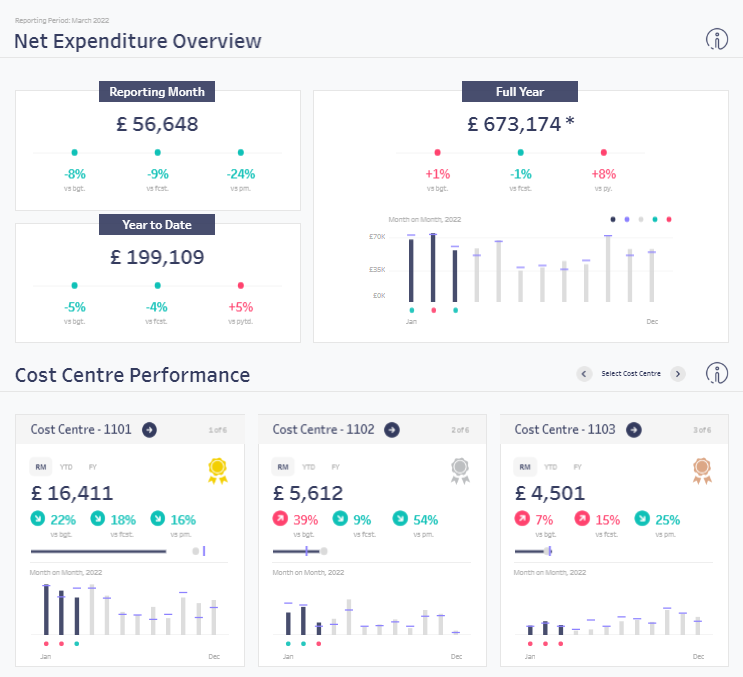
#9 Tableau Financial Dashboards – Net Expenditure Overview Tableau Dashboard
Benefits of Net Expenditure Overview Tableau Financial Dashboards:
- Holistic Financial View. This offers a comprehensive insight into your organization’s spending. With expenditure data, stakeholders can understanding and control over the firm’s financial status.
- Budget Adherence Monitoring. Users can compare actual expenditures against budgeted amounts. This identifying any discrepancies or overspends in real time. This instant comparison aids in enforcing budget discipline.
Potential Users:
- Financial Analysts & Accountants. For accounting professionals, the dashboard is a vital tool for monitoring expenditures. It supports fiscal responsibility and provides valuable financial insights to decision-makers.
- Budget & Finance Managers. Managers can use the dashboard to oversee the organization’s financial resources. This ensures that expenditures align with the budget and financial goals.
- Executive Leadership & Department Heads. Leaders will find value in the dashboard as it provides a clear picture of finances. This overview supports informed strategic planning and decision-making processes.
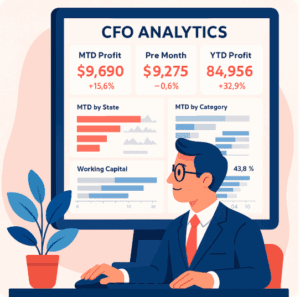
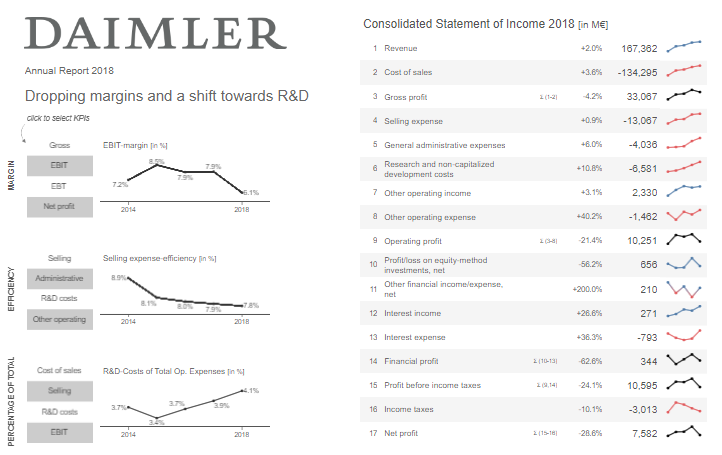
#10 Tableau Financial Dashboards – Income Statement Analysis Tableau Dashboard
Benefits of Income Statement Analysis Tableau Financial Dashboards:
- Comprehensive Financial Picture. The dashboard offers a consolidated and interactive view of a company’s profitability. By visualizing revenues, expenses, and net income, users gain understanding of financial health.
- Trend Identification & Prediction. Users can identify financial trends, expect potential challenges, and predict future profitability. This proactive approach ensures businesses can adapt to evolving financial landscapes.
- Efficient Financial Reporting. The dashboard streamlines the financial reporting. Users can extract detailed insights without sifting through dense financial statements. This efficient access to critical financial metrics ensures that decision-makers are always informed.
Potential Users:
- Chief Financial Officers (CFOs) & Financial Directors. CFOs use the Income Statement Analysis Dashboard to understand the complete financial narrative. This enables them to drive fiscal strategies that align with the company’s goals.
- Financial Analysts. Analysts can delve deep into financial data. They can extract insights and draw correlations between various income statement items.
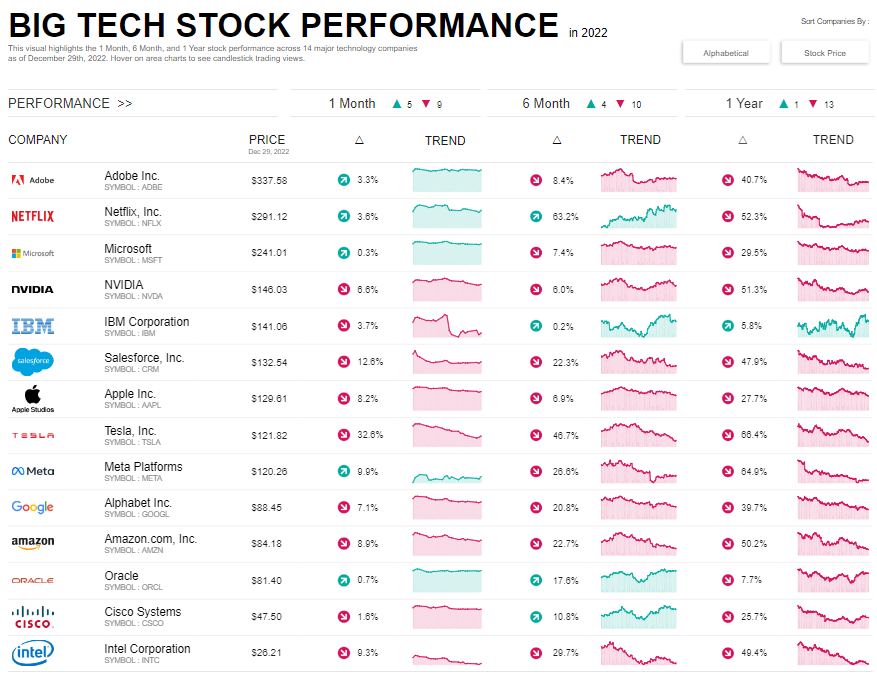
#11 Tableau Financial Dashboards – Big Tech Stock Performance Tableau Dashboard
Benefits of Big Tech Stock Performance Tableau Financial Dashboards:
- Instant Market Insights. This dashboard provides immediate insights into the market dynamics of leading tech companies. Users can track stock price movements, market capitalization, and other critical financial metrics.
- Strategic Investment Planning. Users can analyze and compare the performance of various big tech stocks over time. This aides in developing strategic investment plans.
- Trend Analysis & Forecasting. The dashboard allows for in-depth trend analysis, helping users understand market sentiments.
Potential Users:
- Investment Analysts & Financial Advisors. The dashboard is a tool for analysts and advisors who need understanding of the stock market. It supports comprehensive market analysis. This helps craft informed investment strategies and advice for clients looking to invest in tech stocks.
- Portfolio Managers. Portfolio managers managing tech stock investments will find the dashboard invaluable. It provides a clear representation of stock performance. This allowing for efficient portfolio monitoring and management
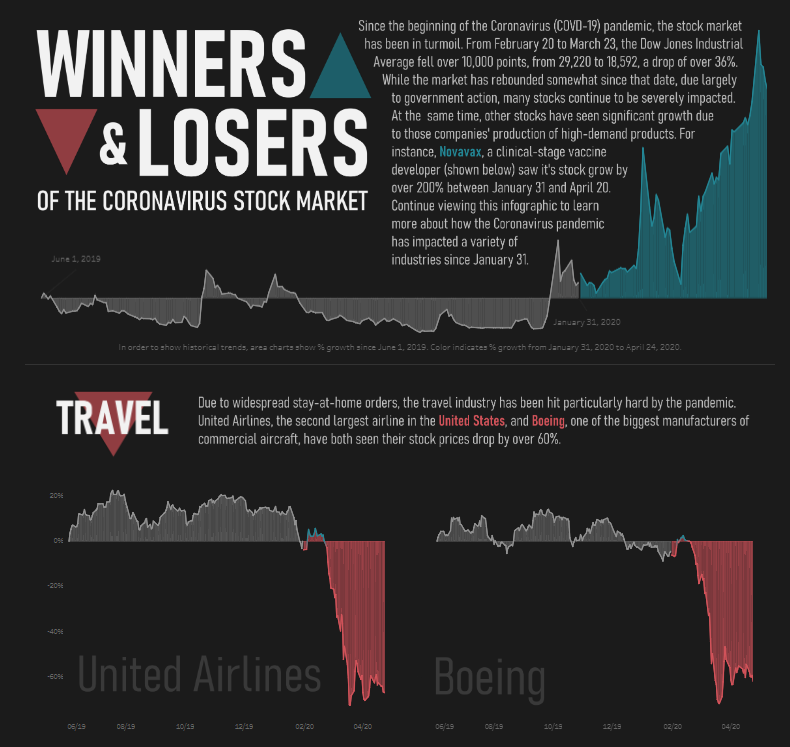
#12 Tableau Financial Dashboards – Winners and Losers of Coronavirus Stock Market Tableau Dashboard
- Instant Market Analysis. Identify which stocks thrived and which took a hit during the Coronavirus pandemic. This insight helps users understand market shifts and pinpoint resilient industries.
- Strategic Investment Insight. The dashboard provides vital data to plan future investments. By showcasing the performance of stocks during the pandemic. Users can leverage this information to make informed decisions.
- Historical Performance Review. Users can review the historical performance of various stocks since the onset of the pandemic.
Potential Users:
- Investment Analysts. Analysts can use the dashboard to conduct a thorough market analysis. They will understand which sectors or stocks were most affected by market changes. This knowledge supports insightful analysis and investment recommendations.
- Portfolio Managers. This dashboard is a beacon for those managing diverse investment portfolios. It illuminates the stocks that weathered the pandemic well and those that faltered.
- Individual Investors & Financial Advisors. Individual investors and financial advisors alike can understand the pandemic’s market impact.
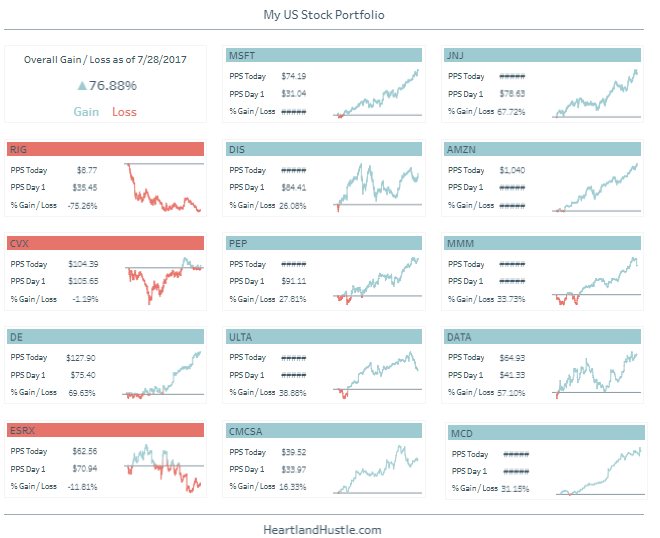
#13 Tableau Financial Dashboards – Stock Portfolio Tableau Dashboard
Benefits of Stock Portfolio Tableau Financial Dashboards:
- Streamlined Portfolio Monitoring. The Stock Portfolio Dashboard offers a seamless and centralized view of your entire stock portfolio, providing instant access to critical data like current value, performance metrics, and historical trends. This consolidated view allows for efficient monitoring and management of your investments.
- Informed Buy/Sell Decisions. With real-time data and visual representations of stock performance, users can make informed buy, sell, or hold decisions. The dashboard supports quick analysis of market conditions and individual stock performance, facilitating strategic investment actions that enhance portfolio value.
- Risk Management and Diversification. The dashboard aids in identifying risks associated with your investment portfolio, promoting effective risk management strategies. It also supports portfolio diversification by providing insights into different stocks and sectors, helping to create a balanced and resilient investment portfolio.
Potential Users:
- Individual Investors. For investors, the dashboard is an invaluable tool for tracking investment performance.
- Portfolio Managers. Professional portfolio managers can leverage the dashboard to watch many clients’ portfolios. It acts as a central hub for portfolio analysis, performance tracking, and strategic planning.
- Financial Advisors & Analysts. Advisors can use the dashboard to provide clients with detailed portfolio reviews. The visualized data supports clear communication of complex financial information.
We hope you have enjoyed this blog series on how Tableau help in the finance domain!
Check out Tableau dashboards for healthcare, marketing and sales.
Please feel free to contact us if you have any questions or suggestions. Keep reading Tableau articles related to marketing, sales and finance here.