Executive dashboards are potent tools that consolidate vast amounts of data into concise, visual summaries, making it easier to track progress, identify trends, and address issues in real time. Whether you’re overseeing sales, marketing, operations, or finance, an effective executive dashboard can provide the insights you need to drive your organization forward.
In this blog post, we’ll explore seven compelling examples of executive dashboards that demonstrate how different industries and departments leverage these tools to achieve their strategic objectives.
Table of Contents
1. Executive Yearly Summary Dashboard
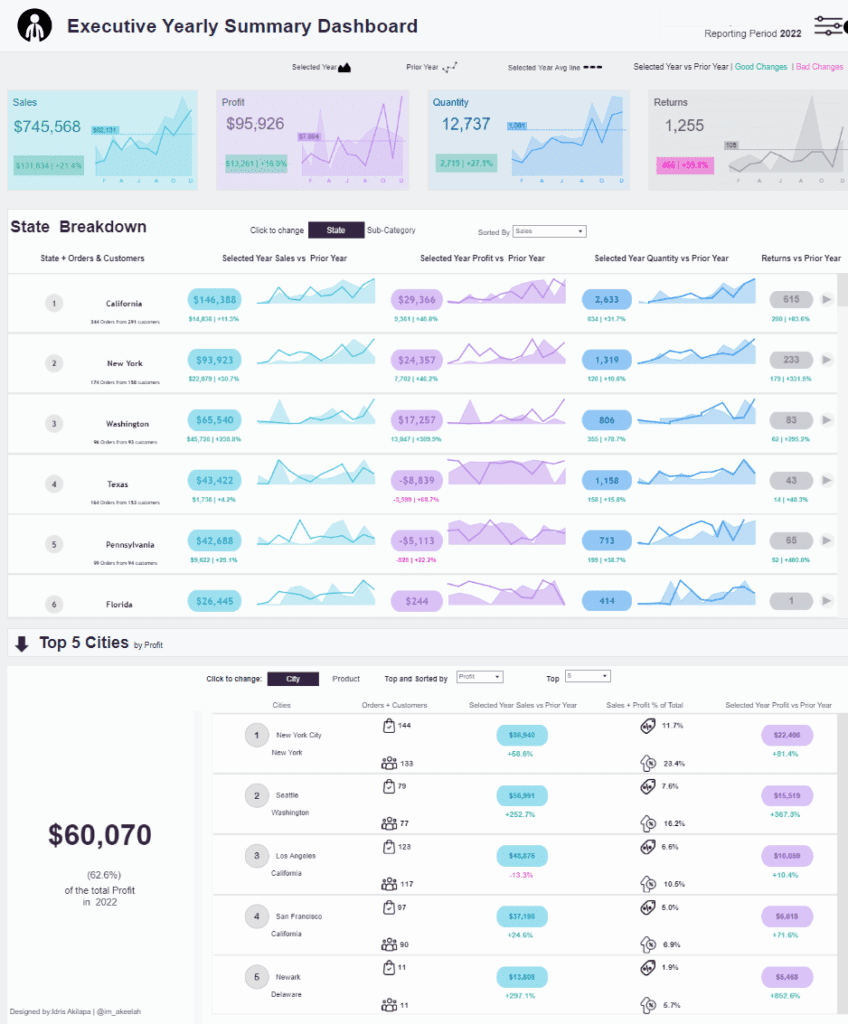
The image displays a Tableau Executive Dashboard designed to provide a comprehensive overview of a company’s key performance metrics for the reporting period 2022. This executive summary dashboard is tailored for leaders who require a high-level view of sales, profits, quantities, and returns, with detailed breakdowns by state and city.
Dashboard Features:
- Critical Metrics Overview: The top section of this executive dashboard highlights essential metrics such as total sales ($745,568), profit ($95,926), quantity (12,737), and returns (1,255). Each metric is accompanied by a line chart that displays trends over the year compared to the prior year, enabling executives to assess overall performance and identify positive and negative trends quickly.
- State Breakdown: Below the key metrics, the Tableau executive dashboard provides a state-by-state breakdown, offering data on orders, customers, sales, profit, quantity, and returns. Each state is represented with its respective financial figures, enhanced by line charts that visualize year-over-year changes. This section is crucial for understanding regional performance and identifying areas of strength or concern.
- Top 5 Cities by Profit: The dashboard also includes a section ranking the top five cities by profit, with New York City leading at $60,070. This part features bar charts and numerical data showing orders, customers, sales, and profit percentages, offering a detailed view of city-level performance.
How an Executive May Use It:
This executive dashboard provides a quick yet comprehensive understanding of the company’s annual performance. Visualizations, such as line and bar charts, facilitate easy comparison of current and prior-year data, helping executives identify trends, spot growth opportunities, and address improvement areas. The detailed breakdowns by state and city assist in making informed decisions about resource allocation and strategy for the upcoming year. This is one of the executive dashboard examples that serves as a powerful tool for driving strategic planning and ensuring the organization stays on track to meet its goals.
2. Executive Summary Dashboard
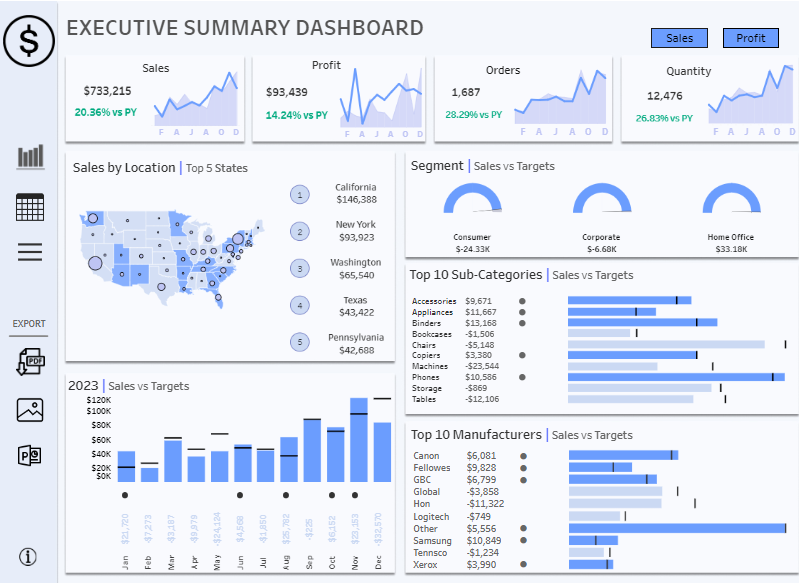
The image displays a Tableau executive dashboard to overview a company’s critical financial and sales metrics comprehensively. This executive summary dashboard is crucial for executives who need to monitor overall performance, assess sales targets, and make data-driven decisions.
Description of the Dashboard:
This executive dashboard summarises critical business metrics such as total sales, profit, orders, and quantity. It includes comparisons with the previous year’s performance (PY), making it easier for executives to identify growth trends or areas needing attention. Additionally, the dashboard provides a breakdown of sales by location, segment, sub-categories, and manufacturers, enabling a detailed analysis of the company’s performance across various dimensions.
Types of Charts in the Dashboard:
- Line Charts: These charts are used at the top of the dashboard to display trends in sales, profit, orders, and quantity over time, helping visualize performance fluctuations throughout the year.
- Map Chart: A geographic heat map illustrates sales distribution across different states in the U.S., highlighting top-performing states such as California and New York.
- Bar Charts: These are prevalent throughout the dashboard, illustrating sales versus targets for the year, top sub-categories, and top manufacturers. The bar charts provide a visual comparison of actual performance against targets.
- Gauge Charts: These charts are used for segment analysis, showing the sales performance of different segments (Consumer, Corporate, Home Office) against their targets.
How an Executive May Use It:
An executive can use this Tableau executive dashboard to understand the company’s financial health and sales performance comprehensively. The dashboard’s line charts provide insights into trends over time, helping to quickly identify whether the company is meeting its sales and profit goals. The bar charts compare actual sales and targets, allowing the executive to pinpoint underperforming areas that may require strategic adjustments. The geographic distribution and segment analysis further enable the executive to make informed decisions about resource allocation, market expansion, and product focus. Overall, this is one of the executive dashboard examples that equips executives with the necessary data to guide strategic planning and drive business growth.
3. Executive Dashboard
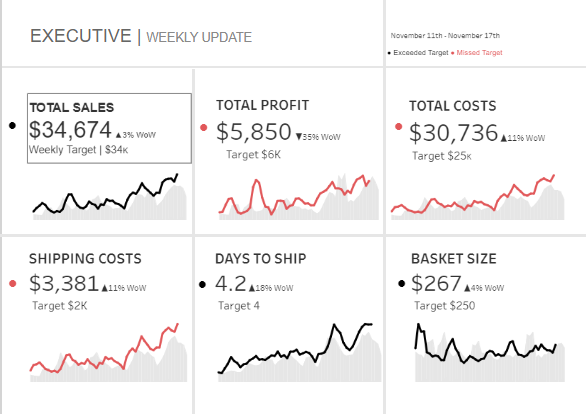
The image displays a Tableau executive dashboard designed to provide a snapshot of key performance metrics over one week. This executive dashboard is crucial for tracking the short-term performance of sales, profits, costs, and operational efficiency against weekly targets.
Description of the Dashboard:
This executive summary dashboard presents six critical metrics: total sales, total profit, total costs, shipping costs, days to ship, and basket size. Each metric is compared to its weekly target, indicating the percentage change week-over-week (WoW). The dashboard highlights whether targets were exceeded or missed, providing an immediate understanding of how the business performs regarding its goals.
Types of Charts in the Dashboard:
- Line Charts: Each metric is visualized with a line chart that tracks its weekly trend. Different colours (black and red) indicate whether the performance is above or below the target. These line charts are effective for monitoring changes and identifying patterns or anomalies in the data.
How an Executive May Use It:
An executive can use this executive dashboard to quickly assess the company’s performance across various metrics within a single week. The line charts offer an easy comparison of actual performance against weekly targets, allowing the executive to identify areas of success and concern. For example, the executive might investigate factors driving higher costs or lower sales if total profit falls short of the target. If shipping costs have increased, the executive could explore potential operational inefficiencies. This Tableau executive dashboard provides clear visual indicators, enabling informed decision-making to celebrate successes or take corrective actions to stay on track with business goals.
4. Executive Summary Dashboard
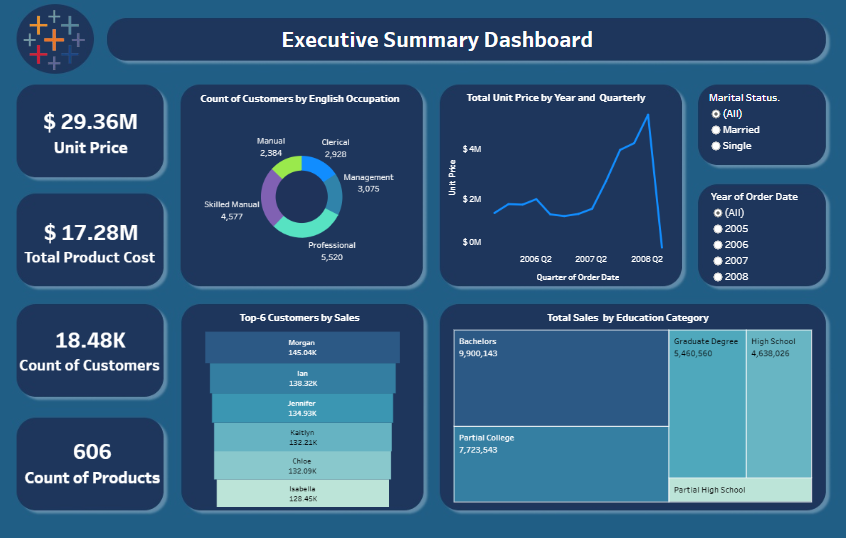
The image displays a Tableau executive dashboard to provide a detailed overview of a company’s key metrics, including financial data, customer demographics, and sales performance. This executive summary dashboard is an essential tool for executives who need to monitor various aspects of the business in one consolidated view.
Description of the Dashboard:
This executive dashboard presents several vital metrics, such as unit price ($29.36M), total product cost ($17.28M), count of customers (18.48K), and count of products (606). The dashboard offers a comprehensive analysis of customer demographics by English occupation, total unit price trends by year and quarter, top customers by sales, and total sales segmented by education category. Additionally, it includes filters for marital status and year of the order date, allowing executives to customize the data view according to specific criteria.
Types of Charts in the Dashboard:
- Pie Chart: The dashboard uses a pie chart to display the count of customers by English occupation, segmenting them into categories like manual, clerical, management, and professional roles.
- Line Chart: A line chart visualizes the trend in total unit price over time, segmented by year and quarter, helping to track pricing dynamics.
- Bar Charts: There are multiple bar charts—one shows the top six customers by sales, while another breaks down total sales by education category. These bar charts provide a clear comparison of performance across different categories.
How an Executive May Use It:
An executive can utilize this Tableau executive dashboard to gain insights into key business areas. The line chart allows for tracking the unit price trends over time, which is critical for pricing strategies. The pie chart and bar charts offer valuable demographic information, helping executives understand customer segments and identify top-performing clients. The filters enable executives to drill down into specific data, such as analyzing sales performance by marital status or a particular year, which supports more targeted decision-making. Overall, this executive dashboard is a powerful tool for monitoring business health, optimizing strategies, and driving informed decisions that align with the company’s goals.
5. Executive Dashboard for ServiceNow
The image displays a Tableau executive dashboard designed to provide a detailed overview of key operational metrics, focusing on incidents, problems, and requests within an organization. This executive summary dashboard is crucial for executives who need to monitor and manage IT service performance, track problem resolution, and ensure that requests are handled efficiently.
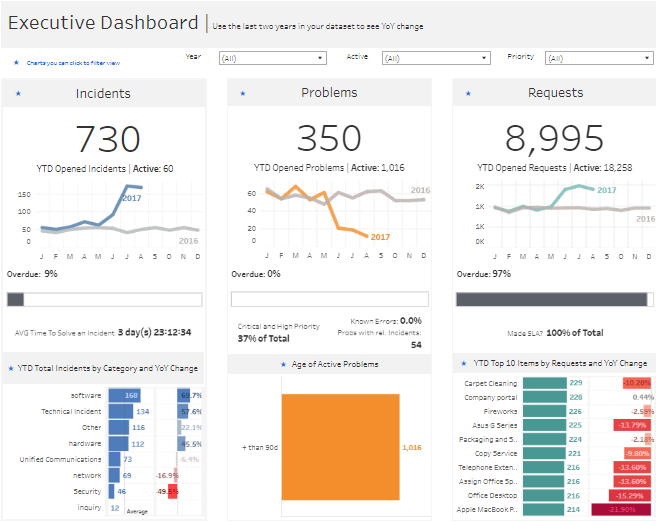
Description of the Dashboard:
This executive dashboard presents three main sections: Incidents, Problems, and Requests. The dashboard displays year-to-date (YTD) data for each category, showing the number of incidents (730), problems (350), and requests (8,995) opened, along with the number of active cases. Additional metrics include the average time to solve an incident, the age of active problems, and the percentage of requests that meet the service level agreement (SLA). This setup allows executives to assess the status and performance of IT services quickly.
Types of Charts in the Dashboard:
- Line Charts: These charts are used in the three main sections (Incidents, Problems, Requests) to display trends in opened cases throughout the year, helping visualize monthly changes and compare current performance with the previous year.
- Bar Charts: Bar charts show the breakdown of incidents and requests by category and their year-over-year (YoY) change, providing a clear comparison across different types of issues or requests.
- Square Chart: A square chart represents the age of active problems, indicating how long issues have remained unresolved and highlighting overdue problems for targeted action.
- Horizontal Bar Chart: A horizontal bar chart displays the top 10 items by requests and their YoY change in the Requests section, identifying the most common service needs.
How an Executive May Use It:
An executive can use this Tableau executive dashboard to monitor the health of the organization’s IT services and support functions. The line charts enable quick comparisons of current performance against the previous year, helping identify trends and potential concerns. The bar charts and square charts provide detailed insights into the types of incidents, problems, and requests being handled and their resolution times. This information allows executives to make informed decisions on resource allocation, prioritize critical issues, and improve service delivery. By using this executive dashboard, executives can ensure that IT services meet organizational needs and promptly address any emerging issues.
6. Call Center Executive
The image displays a Tableau executive dashboard titled Executive Contact Center Overview Dashboard, designed to provide a comprehensive summary of key performance metrics for a contact centre in October 2022. This executive dashboard is crucial for monitoring the performance of different communication channels, including calls, chats, emails, and escalations, helping executives make data-driven decisions to optimize customer service operations.
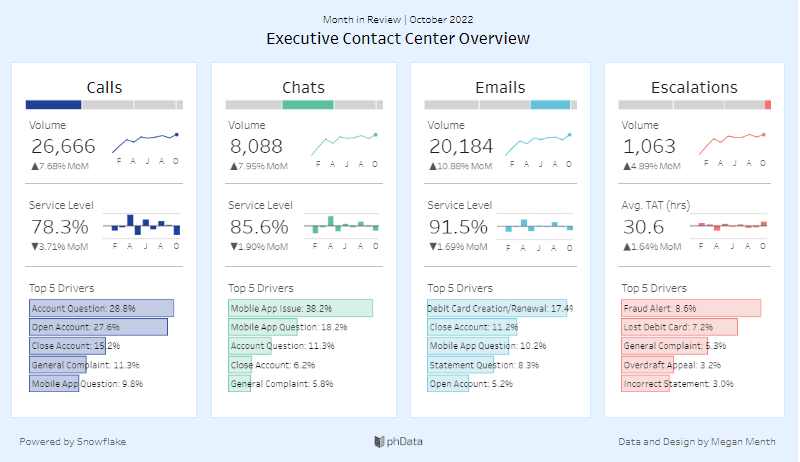
Description of the Dashboard:
This executive summary dashboard presents data across four main categories: Calls, Chats, Emails, and Escalations. For each category, the dashboard displays the volume of interactions, service levels, and the top five drivers of customer inquiries. It also tracks month-over-month (MoM) changes, allowing executives to understand contact centre activity and performance trends. The inclusion of service level percentages and average turnaround times (TAT) provides insights into the contact centre’s efficiency and effectiveness in handling customer interactions.
Types of Charts in the Dashboard:
- Line Charts: Line charts display trends in volume and service levels across the different communication channels over the months (F, A, J, A, O). They help visualize fluctuations and patterns in customer interactions and service performance.
- Bar charts represent the top five drivers for each communication channel, providing a clear breakdown of the most common issues or inquiries that customers contact us about. These charts help identify where the majority of customer concerns lie.
- Gauge Charts: These are used in the service level sections to provide a quick visual representation of performance relative to the target service level.
How an Executive May Use It:
An executive can use this Tableau executive dashboard to monitor and assess the contact centre’s overall performance. The line charts allow for analysing trends in customer interactions and service levels over time, making it easier to identify any significant changes that may need attention. The bar charts, highlighting the top drivers of customer inquiries, provide insights into the most pressing issues customers face, allowing the executive to prioritize resources or implement changes to improve service quality. By closely monitoring these metrics, executives can ensure that the contact centre meets performance targets, addresses customer needs effectively, and maintains high levels of customer satisfaction.
7. Hotel Executive Dashboard
The image displays a Hotel Executive Dashboard to provide a comprehensive overview of key performance metrics for a hotel chain across multiple regions. This Tableau executive dashboard is essential for executives who need to monitor revenue, occupancy, and other critical metrics to make informed decisions and optimize hotel operations.
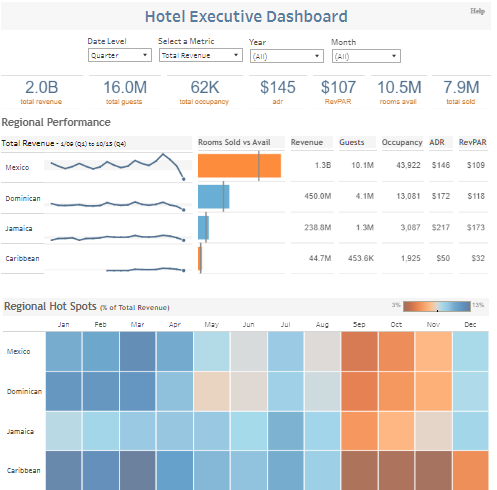
Description of the Dashboard:
This executive summary dashboard presents an array of essential data, including total revenue ($2.0B), total guests (16.0M), total occupancy (62K), Average Daily Rate (ADR) at $145, Revenue Per Available Room (RevPAR) at $107, rooms available (10.5M), and rooms sold (7.9M). The dashboard breaks down performance by region, highlighting revenue, guests, occupancy rate, ADR, and RevPAR for each location, including Mexico, the Dominican Republic, Jamaica, and the Caribbean. This detailed regional performance analysis allows executives to compare different markets and identify trends or areas needing attention.
Types of Charts in the Dashboard:
- Line Charts: These charts display trends in total revenue across various regions, showing how revenue fluctuates over time.
- Bar Charts: Bar charts compare rooms sold versus rooms available across different regions, providing a visual representation of occupancy rates and market performance.
- Heat Maps: The dashboard includes heat maps in the “Regional Hot Spots” section, which show each region’s percentage of total revenue by month. The colour intensity reflects revenue performance, helping to quickly identify high-performing and underperforming periods.
How an Executive May Use It:
An executive can use this dashboard to monitor and assess the performance of various regions within the hotel chain. The line charts allow for the analysis of revenue trends, helping to identify peak seasons and potential downturns. The bar charts provide insights into occupancy rates and market performance, enabling the executive to decide on resource allocation and marketing strategies. The heat maps offer a quick visual reference for identifying high and low revenue months across different regions, which can inform promotional and pricing strategies. This Tableau executive dashboard equips executives with the data they need to drive business growth, optimize operations, and maximize profitability across their hotel properties.
7 Powerful Tableau Executive Dashboard Examples
The seven executive dashboard examples highlighted in this blog post illustrate the versatility and value of these tools in various business contexts. From tracking financial performance and operational efficiency to managing customer relationships and monitoring project progress, executive dashboards offer a comprehensive view of the most critical metrics that drive your business. By implementing a well-designed Tableau executive dashboard tailored to your needs, you can enhance decision-making, improve productivity, and stay ahead of the competition. As you consider optimising your business strategies, let these examples inspire you to harness the power of executive dashboards to achieve your goals and ensure long-term success.