Tableau dashboard templates are powerful tools that help analysts and business users present data in clear, actionable formats. Whether monitoring sales, tracking KPIs, or analyzing customer behavior, having the right Tableau dashboard templates can make all the difference. This blog post explores four practical examples of Tableau dashboard templates catering to different analytical needs. Each template showcases a unique layout and use case, demonstrating Tableau’s flexibility for building compelling visualizations. These examples are ideal for anyone looking to streamline reporting, enhance decision-making, and create visually engaging dashboards with minimal effort.
Table of Contents
How to Use Tableau Dashboard Templates
Getting started with Tableau dashboard templates is quick and easy. Follow these five simple steps to integrate a template into your project:
- Download the Tableau dashboard layout templates workbook using Tableau Desktop.
- Copy the layout by right-clicking the dashboard tab in the workbook and selecting “Copy.”
- You can paste the copied dashboard into your existing workbook by right-clicking any tab and selecting “Paste ” or navigating to File > Paste.
- You can replace the placeholder sheets with your own content, including logos, titles, filters, KPIs, and worksheet visuals.
- You can customise the layout by adjusting colors, fonts, and content to match your brand. You can also maintain the original structure by aligning your new sheets’ outer and inner padding to match the placeholders.
These steps allow you to quickly build professional, on-brand dashboards using Tableau dashboard templates, saving time while maintaining design consistency.
#1 Tableau Dashboard Templates – A1
This Tableau dashboard template is a structured layout to visualize key performance indicators (KPIs) and their associated charts. On the left-hand side, a dark vertical navigation bar includes the Amazon logo, a dashboard title, and buttons for switching between four different views. A filter section is also included for user interaction, allowing filtering based on multiple placeholder options, commonly seen in Tableau dashboard templates.
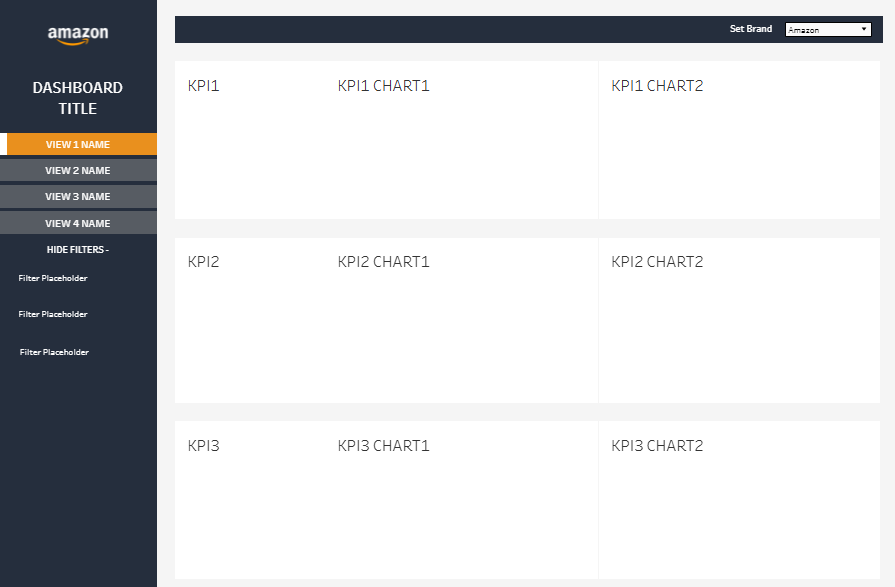
The main content area is divided into three horizontal sections, each representing a different KPI group (KPI1, KPI2, and KPI3). Each row contains the KPI label followed by two associated charts. This layout, typical of Tableau dashboard templates, enables users to compare related data visualizations side by side quickly.
At the top right, a drop-down menu labeled Set Brand allows the user to switch brand context, currently set to Amazon. The design emphasizes clarity and usability, making it suitable for executive dashboards or performance monitoring tools in business intelligence settings.
#2 Tableau Dashboard Templates – A2
This Tableau dashboard template presents a clean, grid-based layout ideal for displaying multiple visualizations simultaneously. The design is structured with two main rows, each containing two sheets, labeled SHEET1 through SHEET4. This four-panel setup allows for clear side-by-side comparisons and is well-suited for parallel analysis of different dimensions or metrics.
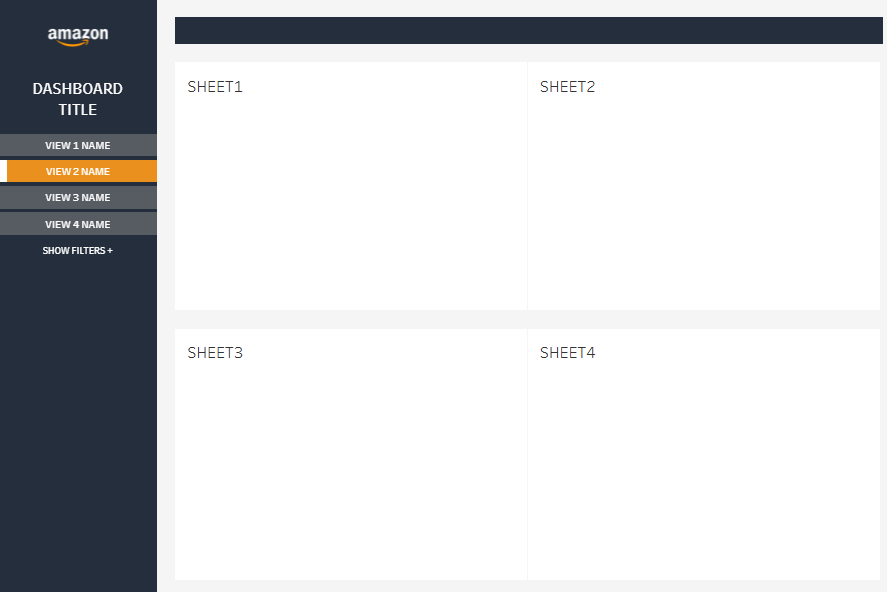
On the left side, a vertical navigation pane includes the Amazon logo, a generic dashboard title, and buttons for toggling between four different dashboard views. The currently active view is highlighted in orange (VIEW 2 NAME), providing clear visual feedback to the user. An expandable filter section labeled “SHOW FILTERS +” allows users to refine the displayed data when needed.
This layout reflects the flexibility and usability found in many Tableau dashboard templates. It’s designed to accommodate various business intelligence needs, offering a scalable structure that can be adapted to different data contexts and visualization requirements.
#3 Tableau Dashboard Templates – A3
This Tableau dashboard template features a balanced, minimalistic layout for streamlined data visualization. The main view is divided into two sections. The top half contains two equally sized panels labeled SHEET1 and SHEET2, which is ideal for comparing two metrics or dimensions side by side. Below these, a larger single panel labeled SHEET3 spans the full width of the dashboard, providing ample space for a more detailed or aggregated visualization.
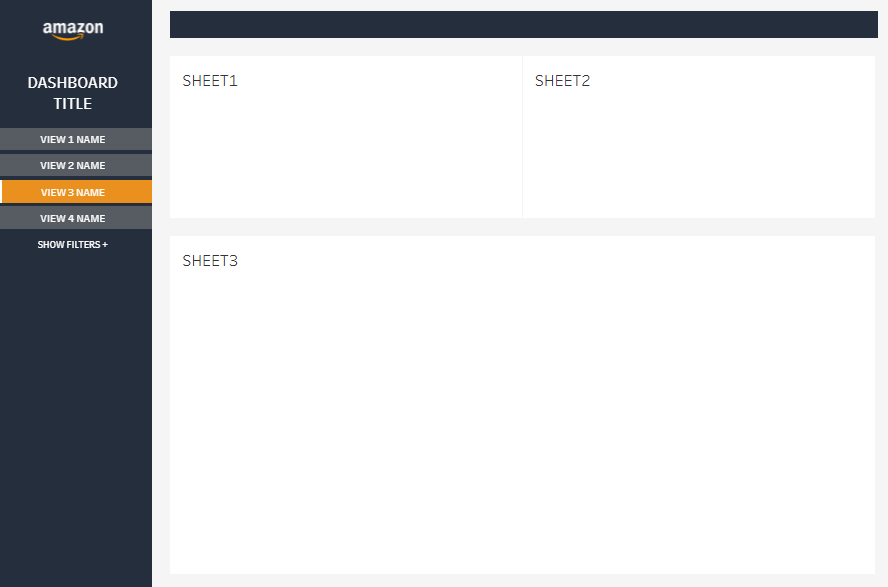
A vertical navigation bar on the left includes the Amazon logo, a placeholder for the dashboard title, and buttons to switch between four views. The currently selected view (VIEW 3 NAME) is highlighted in orange for easy identification. A “SHOW FILTERS +” option indicates expandable filter controls for more interactive analysis.
This structure is consistent with Tableau dashboard templates, offering flexibility for various analytical needs while maintaining a user-friendly, organized layout.
# Tableau Dashboard Templates- A4
This Tableau dashboard template displays a vertical split layout, effectively organizing three sheets for precise, focused analysis. On the left side, SHEET1 occupies the full height of the dashboard, offering a tall space ideal for detailed charts or vertically scrolling tables. On the right side, the layout is divided horizontally into two equal sections: SHEET2 at the top and SHEET3 below it. This configuration helps present related but distinct data sets side by side with one long-form visualization for deeper insights.

A vertical navigation bar on the far left includes the Amazon logo, a generic dashboard title, and buttons for toggling between four dashboard views. The current view (VIEW 4 NAME) is highlighted in orange. A “SHOW FILTERS +” option allows users to access interactive filtering as needed.
This design demonstrates the adaptability of Tableau dashboard templates, providing flexible space allocation for various visual analysis needs in business intelligence.
The versatility of Tableau dashboard templates makes them a valuable asset for any data-driven organization. From side-by-side chart comparisons to multi-panel layouts with interactive filters, each example highlights a unique approach to visualizing and exploring data. Leveraging Tableau dashboard templates lets you jumpstart your design process and deliver impactful insights faster. Whether you’re a beginner or a seasoned analyst, using well-structured Tableau dashboard templates saves time and ensures consistency across reports. Start experimenting with these layouts to elevate your data storytelling and bring clarity to your business intelligence strategy.