
What is a Tableau Customer Churn Dashboard?
A Tableau churn dashboard can stop your customers from ghosting you. A customer churn dashboard is a tool that provides a concise overview of churn. Customer churn is the rate at which customers stop doing business with your company. A Tableau customer churn dashboard consolidates relevant data and metrics related to customer behaviour. This allows your businesses to analyze churn trends and risks. You can then take proactive measures to mitigate customer attrition.
So, What Exactly is Customer Churn?
Customer churn is the rate customers stop their relationship with your company. This is not a good thing. It is a critical metric for your business, impacting revenue and profitability. And this affects the long-term sustainability of your business. So, we must get a handle on the rate at which your customers are churning, as the very existence of your business is at stake!
Customer churn can occur due to a variety of reasons. These can be dissatisfaction with a product or service, poor customer experience, or lack of engagement or value. More reasons are other competitive offerings, pricing issues or changing customer needs.
Each lost customer represents a loss of potential future revenue. It also means the cost of finding new customers to replace them.
Understanding customer churn is crucial to your businesses for a healthy customer base. A Tableau customer churn dashboard is the perfect tool for monitoring churn.
By analyzing your customer churn patterns, your businesses can gain insights into the underlying causes of churn. Thus, you can take proactive measures to reduce churn rates.
This may involve improving product quality and enhancing customer support or personalizing offerings. Additional measures include implementing loyalty programs and providing incentives for customer retention.
Reducing customer churn has several benefits, including extending the customer relationship. This increases revenue potential and customer loyalty.
A Tableau churn analysis dashboard can help prevent your customers from ghosting you!
So, tell me more about how a customer churn dashboard can help…
A customer churn Tableau dashboard enables your businesses to reduce churn. It can display key performance indicators such as:
- Churn rate
- Customer retention rate
- Customer acquisition cost
Key features of a customer churn dashboard may include:
Churn Metrics
The churn analytics dashboard provides metrics related to customer churn. This includes the number of churned customers and churn rate over a specific period (e.g. monthly, quarterly, annually).
Trend Analysis
The churn dashboard provides visualizations and trend analysis of churn rates. This allows your business to identify where your customers are churning.
Customer Insights
The churn dashboard can provide insights into customer behaviour, preferences, and satisfaction levels. These insights help your business understand the underlying reasons for churn. Thus, you can develop targeted retention initiatives.
Benchmarking and Goals
The dashboard shows benchmarks and targets to compare churn performance against internal goals. Your business can assess its churn performance and set realistic targets for improvement.
A Tableau customer churn dashboard serves as a central hub for monitoring churn. It empowers your businesses to track and understand customer attrition.
How can a customer churn dashboard Tableau help your business?
Tracking customer churn can provide several benefits for your business. Here are some ways it can help:
Identify Underlying Issues
Tracking customer churn in a churn analysis dashboard allows your business to identify the root causes of customer attrition. Your business can uncover patterns, trends, and common reasons customers leave. This information helps identify areas for improvement, whether product quality, customer service, or pricing.
Retention Strategy Development
Your company will improve customer satisfaction by addressing specific pain points of your customers. This may involve product enhancements, personalized offers, loyalty programs, or enhanced customer support.
Financial Forecasting and Revenue Management
Customer churn impacts revenue and profitability. By tracking churn rates, your business can estimate future income. This information helps in financial forecasting, budget allocation, and resource planning.
Customer Experience Improvement
Churn tracking helps your business identify pain points in your customer’s journey. Your business can make data-driven decisions to improve its products, services, and processes. This will foster customer satisfaction, loyalty, and positive word-of-mouth referrals.
Customer Acquisition Cost Optimization
Acquiring new customers is more expensive than retaining existing ones. Your business will learn the financial impact of losing customers by tracking churn. This information can guide decisions on customer acquisition strategies and marketing investments.
What happens if you ignore customer churn?
If your business ignores customer churn, there are several negative consequences:
Revenue Decline
Customer churn affects your business’s revenue. When your customers leave, your business loses the customer’s revenue in the future. Ignoring customer churn can lead to a continuous decline in revenue. This makes it challenging to sustain growth and profitability.
Increased Customer Acquisition Costs
Neglecting customer churn forces your business to rely on acquiring new customers. Acquiring new customers often involves higher costs, such as marketing and advertising expenses, sales efforts, and promotional offers. If customer churn remains unaddressed, your business will incur escalating customer acquisition costs.
Weakened Customer Loyalty and Reputation
Failing to address customer churn can erode customer loyalty. Unsatisfied customers are more likely to share their negative experiences with others. This can lead to a negative perception of your business. This results in decreased trust. This results in a damaged brand image. You get the picture.
Missed Opportunities for Improvement
Customer churn provides valuable insights into areas for improvement within a business. By ignoring churn, your business fails to understand why customers are leaving. These insights can help identify gaps in product offerings or customer service.
Competitive Disadvantage
Your business needs to differentiate itself. Ignoring churn puts your business at a disadvantage. Competitors who manage churn have stable revenue streams and loyal customer bases.
Who Can Benefit from a Churn Dashboard?
Customer Success Managers enjoy churn dashboards by addressing churn risks.
Sales and Marketing Teams can improve retention strategies using churn dashboard insights.
Product Development Teams make data-driven decisions for product improvements based on churn dashboards.
Finance Teams analyze churn data to assess revenue impact and divide financial resources.
Customer Support Teams identify and address common issues leading to churn.
Operations and Logistics Teams optimize processes based on churn dashboard insights to reduce churn.
Customer Experience Teams enhance the overall customer journey by analyzing churn dashboard data.
Retention Specialists develop personalized strategies to retain at-risk customers using churn dashboard information.
Business Analysts leverage churn dashboards for in-depth analyses and strategic business insights.
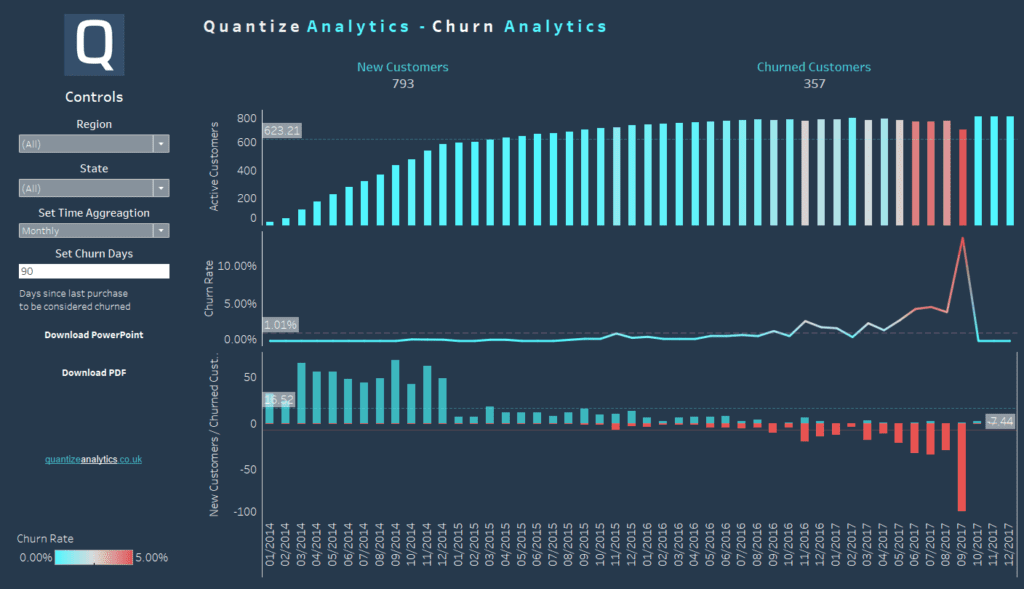
An Example of A Churn Dashboard
Below, we see some components of a customer churn dashboard.
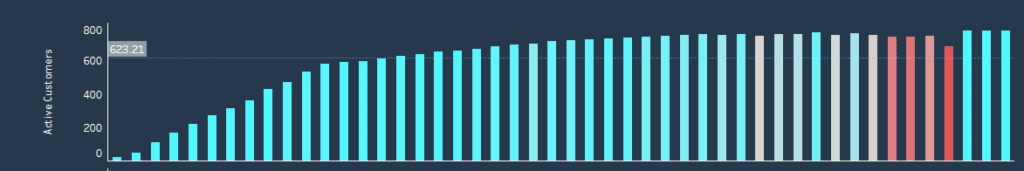
The image below shows the number of active customers by month. Active customers are the cumulation of new customers, fewer customers that have not purchased anything in a specific period. The churn rate represents the colours of the bars. We can see from the line going across the chart that the average number of active customers per month is 623.
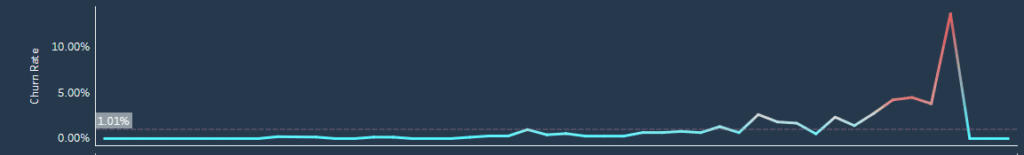
The chart below shows the churn rate for each month. The formula for churn rate is the difference between customers at the beginning of the month and minus churned customers, divided by the customers at the beginning of the month. We can see that towards the end of this time series, a large problem with churning customers would warrant investigation. We can also see that the average churn rate for all months is roughly one per cent.
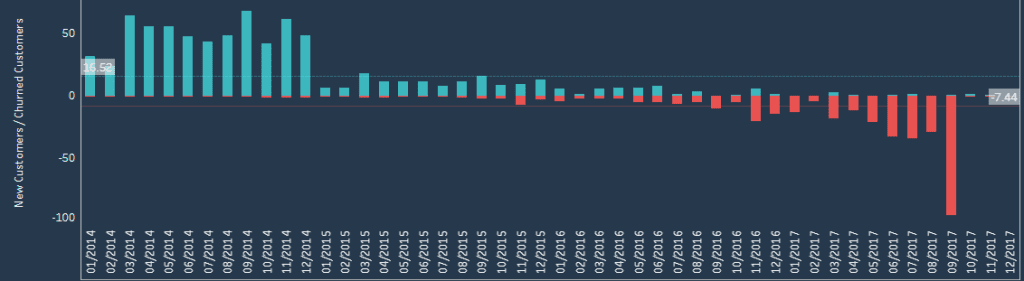
The chart below shows the new customers versus churned customers.
A new customer is a customer who has purchased something for the first time. A churned customer has not purchased anything in a given period (e.g. 90 days in this example). We can see a large problem with a significant drop-off in new customers and increased churning customers. This is not great. However, given that we are aware of this information, there are steps we can now take to remediate this situation.
Customer Churn Dashboard Summary
Neglecting customer churn has severe implications for your business. This includes:
- Declining revenue
- Increased customer acquisition costs
- Damaged reputation
- Missed opportunities for improvement
- Competitive disadvantages
Customer churn focus is crucial for maintaining a healthy customer base.
So contact us to talk about a churn dashboard to prevent your customers from ghosting you!


One Response