In the rapidly evolving world of cryptocurrencies, robust data analysis tools are crucial. With its powerful data visualization capabilities, Tableau emerges as a leading platform for crypto analytics. This blog aims to inspire and guide you through the myriad ways crypto Tableau can be used to dissect and understand the crypto market.
We will showcase eight exemplary dashboards, each highlighting different aspects of cryptocurrency analysis—from price trends and market volatility to mining metrics and comparative studies. Dive in to discover how Tableau crypto tools can transform raw crypto data into actionable insights, making it an indispensable cryptocurrency analysis tool.
Table of Contents
Affiliate Disclosure: Some of the links on this blog are affiliate links, which means if you click on them and make a purchase, we may receive a commission at no extra cost to you. This helps support our blog and allows us to continue to create content for you. We only recommend products and services we genuinely believe in; all opinions expressed here are our own. Thank you for being so supportive!
These great Tableau dashboards have been curated from Tableau public, we do not take credit for their creation.
#1 CryptoMarket
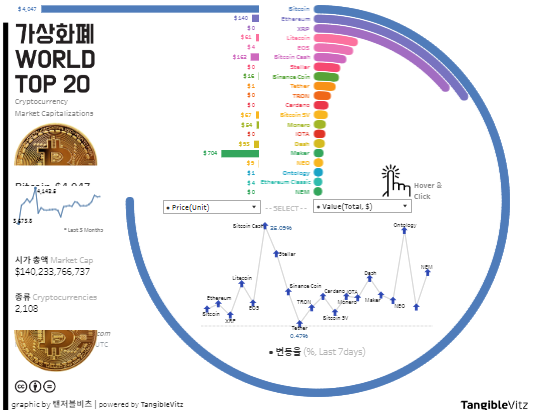
This Tableau crypto dashboard comprehensively overviews the top 20 cryptocurrencies by market capitalization. It combines charts and visual elements to offer a detailed snapshot of the cryptocurrency market’s current state and historical trends.
Components and Charts:
- Market Capitalization Chart:
- The left section displays the WORLD TOP 20 cryptocurrencies, ranked by market capitalization. This is visually represented by horizontal bars, each color-coded to distinguish different cryptocurrencies.
- Cryptocurrency Price Chart:
- Below the title and ranking, there’s a line graph showing Bitcoin’s (BTC) price trend over the last six months. This helps users understand Bitcoin’s historical performance, which is a significant indicator for the market.
- Hover & Click Interactive Element:
- In the centre, an interactive element encourages users to hover and click to get more detailed information on each cryptocurrency, such as price per unit and total value.
- 7-Day Volatility Line Chart:
- The bottom right section features a line chart depicting the percentage volatility of various cryptocurrencies over the last seven days. Each data point is marked with the cryptocurrency’s abbreviation, making it easy to compare their recent performance.
- Additional Information:
- Market cap and total number of cryptocurrencies are displayed under the Bitcoin price chart, giving a quick reference to the overall market size and scope.
Target Audience:
This Tableau crypto dashboard is designed for a wide range of users, including:
- Cryptocurrency Investors: Both new and experienced investors can benefit from this crypto analytics tool to make informed decisions.
- Financial Analysts: Analysts looking for quick insights into the market trends and volatility will find this cryptocurrency analysis tool invaluable.
- Traders: Active traders can utilize the recent volatility data to strategize their trades using this crypto analysis tool.
- General Enthusiasts: Anyone interested in cryptocurrencies would find this Tableau blockchain dashboard informative and engaging.
Overall, this Tableau crypto dashboard effectively uses graphical elements to present complex data in an accessible and interactive manner, making it the best crypto analysis tool for monitoring the cryptocurrency market.
#2 Crypto Coins
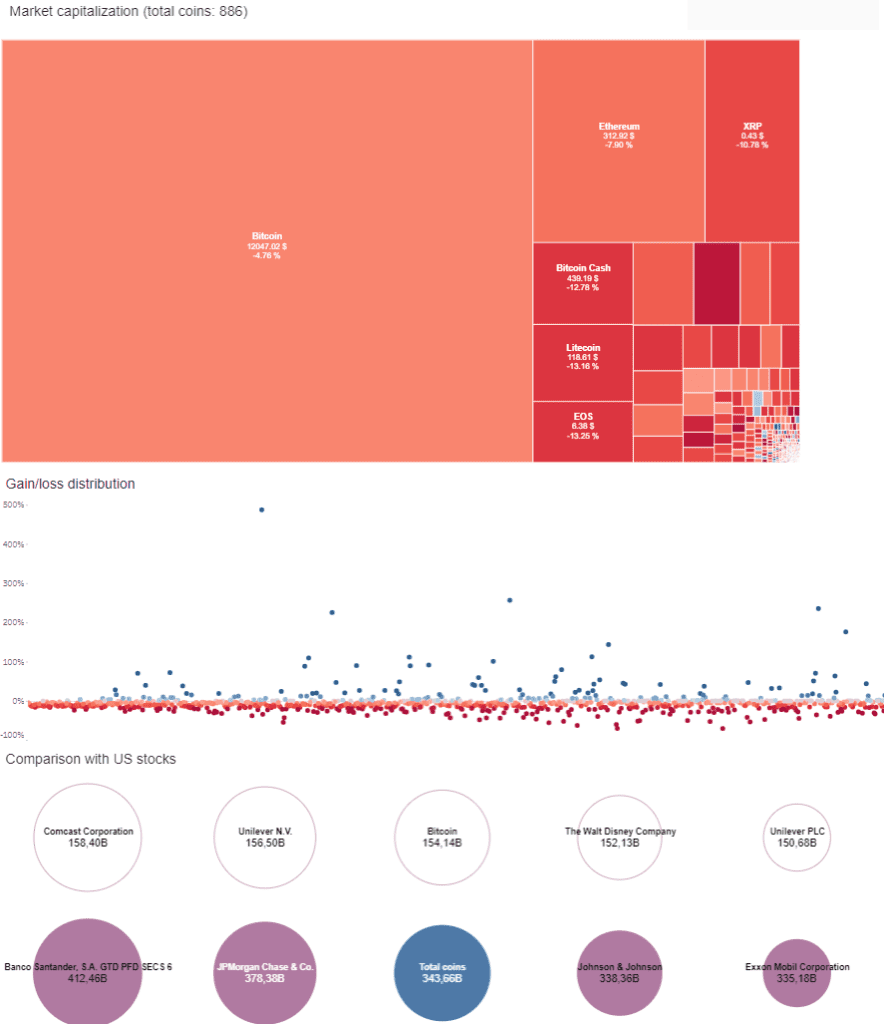
This cryptocurrency Tableau dashboard provides a detailed overview of the market capitalization, gain/loss distribution, and a comparison of cryptocurrencies with US stocks. It is designed to give users a comprehensive insight into the current state of the cryptocurrency market.
Components and Charts:
- Market Capitalization Treemap:
- The top section features a treemap showing the market capitalization of 886 coins. Each block represents a different cryptocurrency, with the size of the block corresponding to its market capitalization. Bitcoin, Ethereum, XRP, Bitcoin Cash, Litecoin, and EOS are prominently displayed, indicating their significant market share. The colour intensity indicates the percentage change, with red shades denoting losses.
- Gain/Loss Distribution Scatter Plot:
- The middle section presents a scatter plot of various cryptocurrencies’ gain/loss distribution. This chart visually represents each coin’s performance, with points scattered across the plot showing their percentage change. Blue dots represent gains, while red dots represent losses, making it easy to identify which cryptocurrencies have performed well or poorly.
- Comparison with US Stocks:
- The bottom section compares the market capitalizations of leading cryptocurrencies with major US stocks. Circular bubbles of varying sizes represent companies like Comcast, Unilever, Walt Disney, JPMorgan Chase, Johnson & Johnson, and Exxon Mobil. Bitcoin and the total cryptocurrency market are also included, providing a perspective on how the crypto market stacks up against traditional financial giants.
Target Audience:
This cryptocurrency Tableau dashboard is ideal for the following:
- Cryptocurrency Investors: Individuals looking to track market trends and performance of various cryptocurrencies.
- Financial Analysts: Professionals seeking detailed crypto analytics to compare cryptocurrencies with traditional stocks.
- Traders: Active traders who need to analyze market movements and volatility.
- Market Enthusiasts: Anyone interested in gaining insights into the cryptocurrency market and its relation to traditional financial markets.
Overall, this Tableau blockchain dashboard serves as a powerful cryptocurrency analysis tool. It offers visual and interactive insights into the crypto market, making it one of the best crypto analysis tools for investors and analysts.
#3 The Bitcoin Bubble
This Tableau crypto dashboard provides an in-depth look at Bitcoin’s market performance, highlighting key metrics such as market capitalization, trading volume, and historical price trends. It is designed to offer comprehensive insights into Bitcoin’s behaviour over time, making it a valuable cryptocurrency analysis tool.

Components and Charts:
- Price and Market Data Overview:
- At the top, the dashboard presents Bitcoin’s current price, market capitalization, and trading volume. These figures are displayed prominently, allowing users to grasp the cryptocurrency’s latest performance quickly. Additionally, the dashboard shows the highest and lowest prices of Bitcoin within a specific timeframe, offering a snapshot of its volatility.
- Historical Price Trend Chart:
- The central feature of the dashboard is a line chart that tracks Bitcoin’s price from its early days to the present. This chart visually represents Bitcoin’s growth, peak, and subsequent decline, emphasizing significant milestones such as the December 2017 all-time high.
- Interactive Elements:
- The dashboard includes interactive components. Users can hover over the chart to view detailed metrics for specific dates. This interactivity enhances the user experience by allowing a more granular analysis of Bitcoin’s historical performance.
- Narrative and Context:
- To the right of the price chart, a narrative section details critical events in Bitcoin’s history, such as the peak of its frenzy in December 2017 and the subsequent market correction. This context helps users understand the market forces and events influencing Bitcoin’s price movements.
Target Audience:
This cryptocurrency Tableau dashboard is ideal for the following:
- Cryptocurrency Investors: Individuals looking to track Bitcoin’s historical and current performance to inform their investment strategies.
- Financial Analysts: Professionals seeking detailed crypto analytics to understand Bitcoin’s market dynamics.
- Traders: Active traders who need to analyze Bitcoin’s price trends and market fluctuations to make informed trading decisions.
- Market Enthusiasts: Anyone interested in gaining insights into Bitcoin’s historical milestones and overall market behaviour.
This Tableau blockchain dashboard is one of the best crypto analysis tools. It offers visual and interactive insights into Bitcoin’s market performance, making it invaluable for investors and analysts.
#4 Bitcoin Price and Sentiment
This Tableau crypto dashboard provides an insightful analysis of Bitcoin’s price and market sentiment over time. It combines various charts to offer a comprehensive overview of Bitcoin’s historical price movements, market trends, and sentiment metrics, making it an essential cryptocurrency analysis tool.

Components and Charts:
- Historical Price Trend Chart:
- The top section features a detailed line chart tracking Bitcoin’s price history. This chart includes moving averages (Bollinger Bands, Simple Moving Average) to help visualize price trends and volatility. Users can see how Bitcoin’s price has fluctuated over time, providing valuable context for investment decisions.
- MACD (Moving Average Convergence Divergence) Chart:
- The middle section presents a MACD chart, a popular crypto analysis tool for identifying potential buy and sell signals. The MACD line, signal line, and histogram offer insights into momentum changes and trend reversals in Bitcoin’s price, aiding traders in making informed decisions.
- Sentiment Analysis Bar Chart:
- The bottom section displays a bar chart of market sentiment, showing the distribution of positive and negative feelings over time. This chart uses colour coding to differentiate between positive and negative sentiments, providing a clear picture of market emotions and potential impacts on Bitcoin’s price.
Target Audience:
This cryptocurrency Tableau dashboard is ideal for:
- Cryptocurrency Investors: Individuals seeking to understand Bitcoin’s historical price trends and market sentiment to guide their investment strategies.
- Financial Analysts: Professionals looking for detailed crypto analytics to analyze Bitcoin’s market dynamics and predict future price movements.
- Traders: Active traders must monitor Bitcoin’s price trends, identify trading signals, and assess market sentiment to optimize their trading strategies.
This Tableau blockchain dashboard is one of the best crypto analysis tools. It offers visual and interactive insights into Bitcoin’s price and sentiment analysis, making it invaluable for investors and analysts.
#5 Bitcoin Price
This Tableau crypto dashboard analyses Bitcoin’s performance metrics, mining progress, and price trends. It provides a comprehensive overview of Bitcoin’s market status and mining statistics, making it a powerful cryptocurrency analysis tool.

Components and Charts:
- Bitcoin Price Chart:
- The dashboard’s centre features a line chart displaying Bitcoin’s price over time, highlighting the significant milestone of reaching USD 10,000 on November 28, 2017. This chart provides a visual representation of Bitcoin’s price surge and its daily high value.
- Mining Progress:
- The top left section shows a gauge indicating the percentage of total Bitcoin mined, with 79.6% of the total 21 million Bitcoins mined, amounting to 16.7 million. This gauge helps users track the progress of Bitcoin mining.
- Hashing Power:
- The bottom left section includes a line chart illustrating the exponential growth in Bitcoin’s hashing power, currently at 11.4 Exa Hashes per second. This chart emphasizes the immense computational power dedicated to Bitcoin mining, being approximately 1,300,000 times faster than the world’s fastest supercomputer.
- Year-to-Date (YTD) Increase:
- The top right section features a chart depicting Bitcoin’s 967% increase YTD, demonstrating its dramatic price rise within the year. This chart visually emphasizes Bitcoin’s rapid appreciation in value over a short period.
- Data and Sources:
- The bottom right includes a disclaimer and information about the data sources used, highlighting the credibility and origins of the data presented. This section also credits the creator and offers additional resources for further exploration.
Target Audience:
This cryptocurrency Tableau dashboard is ideal for the following:
- Cryptocurrency Investors: Individuals looking to monitor Bitcoin’s price trends, mining progress, and overall market performance to inform their investment strategies.
- Financial Analysts: Professionals seeking detailed crypto analytics to analyze Bitcoin’s market dynamics and mining efficiency.
- Traders: Active traders must stay updated on Bitcoin’s price movements and market trends to optimize their trading strategies.
- Market Enthusiasts: Anyone interested in gaining insights into Bitcoin’s performance metrics and mining statistics.
Overall, this Tableau blockchain dashboard is one of the best crypto analysis tools. It offers visual and interactive insights into Bitcoin’s market performance and mining activities, making it invaluable for investors and analysts alike.
#6 Visualizing Bitcoin (Cryptocurrency) Volatility
This cryptocurrency Tableau dashboard offers a vibrant and engaging analysis of Bitcoin’s volatility over time, highlighting key price milestones and market trends. It is designed to provide a comprehensive overview of Bitcoin’s price fluctuations and historical data, making it an essential cryptocurrency analysis tool.

Components and Charts:
- Volatility Timeline:
- The central visual element is a timeline chart that tracks Bitcoin’s price volatility from 2017 to 2021. The chart uses vertical bars to indicate the rise and fall of Bitcoin prices, with yellow bars representing price increases and red bars representing price decreases. This visual representation helps users quickly grasp the extent and frequency of Bitcoin’s price changes.
- Price Milestones:
- On the left side of the dashboard, key Bitcoin price milestones are highlighted, including the all-time high of $64,895, the all-time low of $1,500, and the current value of $56,987 as of May 10, 2021. This section gives users a quick reference to significant price points in Bitcoin’s history.
- Stylized Background:
- The dashboard features a stylized cityscape background with a prominent Bitcoin logo, creating an engaging visual context for the data. The background elements add an aesthetic appeal while ensuring the critical information remains the focal point.
Target Audience:
This cryptocurrency Tableau dashboard is ideal for:
- Cryptocurrency Investors: Individuals looking to understand Bitcoin’s historical volatility to inform their investment strategies.
- Financial Analysts: Professionals seeking detailed crypto analytics to analyze Bitcoin’s price dynamics and market behaviour.
- Traders: Active traders must monitor Bitcoin’s price fluctuations and volatility trends to optimize their trading decisions.
- Market Enthusiasts: Anyone interested in gaining insights into Bitcoin’s historical price movements and volatility patterns.
Overall, this Tableau blockchain dashboard is one of the best crypto analysis tools. It offers visual and interactive insights into Bitcoin’s market volatility, making it invaluable for investors and analysts alike.
#7 Bitcoin Price – YoY Comparison
This cryptocurrency Tableau dashboard provides a year-over-year comparison of Bitcoin prices adjusted to the Dow Jones Industrial Average. It offers a clear visualization of Bitcoin’s performance over multiple years, making it an essential cryptocurrency analysis tool for investors and analysts.

Components and Charts:
- Year-over-Year Price Comparison Chart:
- The main feature of the dashboard is a line chart that compares Bitcoin’s closing prices over three different years: 2019, 2020, and 2021. Each year is represented by a different colour line (red for 2019, orange for 2020, and yellow for 2021), allowing users to easily distinguish between the years and observe the trends and volatility in Bitcoin’s price.
- Date Range Selector:
- The top right corner of the chart includes a dropdown menu that allows users to adjust the granularity of the data displayed (e.g., daily, monthly). This interactive element helps users tailor the visualization to their specific needs, whether looking for short-term trends or long-term performance.
- Data Source and Update Information:
- Below the title, the dashboard provides the last update timestamp, and the data sources used (Google Finance). This transparency ensures users have confidence in the accuracy and timeliness of the information presented.
Target Audience:
This cryptocurrency Tableau dashboard is ideal for the following:
- Cryptocurrency Investors: Individuals looking to understand how Bitcoin’s performance has changed over the past few years to inform their investment strategies.
- Financial Analysts: Professionals seeking detailed crypto analytics to compare Bitcoin’s price movements with broader market trends.
- Traders: Active traders must monitor Bitcoin’s price trends and volatility to optimize their trading strategies.
- Market Enthusiasts: Anyone interested in gaining insights into Bitcoin’s historical price movements and how they relate to the overall market.
Overall, this Tableau blockchain dashboard is one of the best crypto analysis tools. It offers visual and interactive insights into Bitcoin’s year-over-year performance, making it invaluable for investors and analysts alike.
#8 Evolution of Bitcoin
This cryptocurrency Tableau dashboard overviews Bitcoin’s price evolution, highlighting significant milestones and market trends. It offers a clear visualization of Bitcoin’s price fluctuations over several years, making it a valuable cryptocurrency analysis tool for various stakeholders.

Components and Charts:
- Historical Price Line Chart:
- The dashboard’s main feature is a line chart that tracks Bitcoin’s adjusted close price from June 2014 to June 2021. The chart effectively visualizes Bitcoin’s dramatic price changes over this period, with notable peaks and troughs marked.
- Milestone Markers:
- Key price milestones are highlighted with callout boxes on the chart. For instance, on December 16, 2017, Bitcoin reached $19,497; on December 15, 2018, it dropped to $3,237; and on February 14, 2021, it soared to $48,717. These markers provide context for significant events in Bitcoin’s price history.
- Narrative and Context:
- The top section includes a brief narrative summarising recent trends, noting how Bitcoin neared $50,000 and reflecting on past dramatic drops, such as the over 80% decline after surpassing $20,000. This narrative helps users understand the broader market context and potential future scenarios.
Target Audience:
This cryptocurrency Tableau dashboard is ideal for the following:
- Cryptocurrency Investors: Individuals looking to track Bitcoin’s historical performance to inform their investment decisions.
- Financial Analysts: Professionals seeking detailed crypto analytics to analyze Bitcoin’s price trends and market behaviour.
- Traders: Active traders must monitor Bitcoin’s price history to identify patterns and optimize their trading strategies.
- Market Enthusiasts: Anyone interested in gaining insights into the historical price movements and significant milestones of Bitcoin.
Overall, this Tableau blockchain dashboard is one of the best crypto analysis tools. It offers visual and interactive insights into Bitcoin’s market evolution, making it invaluable for investors and analysts alike.
Tableau crypto tools offer a transformative approach to cryptocurrency analysis. The examples shared in this blog show that Tableau’s capabilities extend far beyond basic data visualization. From tracking price trends, analyzing market volatility, examining mining metrics, and making comparative studies, crypto Tableau dashboards provide deep insights crucial for informed decision-making. Whether you are an investor, analyst, trader, or crypto enthusiast, leveraging Tableau blockchain analytics can enhance your understanding and strategy. As the best crypto analysis tool available, cryptocurrency Tableau empowers users to turn complex data into clear, actionable intelligence. Explore these tools and elevate your crypto analytics to the next level.