Tableau Candlestick charts are unlike other visualizations because their use is limited
to trading. That being said, Tableau Candlestick charts are a powerful tool for
traders because they effectively do what they’re designed for.
Table of Contents

Datasource to follow along with Tableau Candlestick Chart Tutorial
Attached is the data source you can follow along with this tutorial with. It is the price history of the ticker BIG, which is the company Big Lots.
What are Tableau Candlestick charts about?
Traders use candlestick charts to understand the price movements of securities (think
bonds or stock). From a Tableau Candlestick chart, a wealth of information, such as the high,
low, open, and close values for security, can be gleaned from a glance.
What do Tableau Candlestick charts look like?
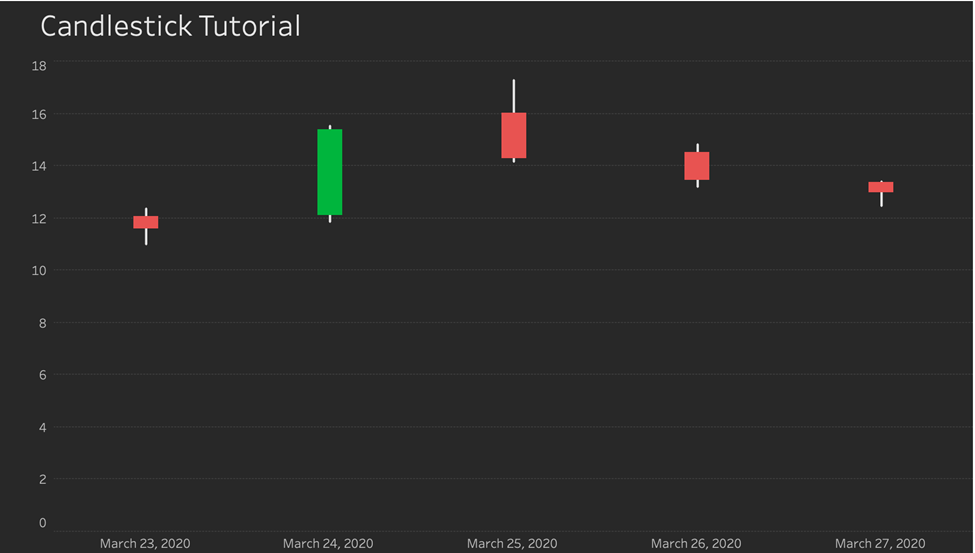
Below is an image of a Tableau Candlestick chart. The filled rectangles, known as the body, show the opening and closing price. The lines extending from the top and bottom of the body are known as wicks, representing the price highs and lows.
Red colours indicate that the closing price was lower than the opening price, whereas
green colours suggest that the closing price was higher than the opening price.
Let’s make a Tableau Candlestick chart!
Let’s jump into how to make one of these in Tableau without further ado.
Let’s start with our calculated fields.
Ticker Change
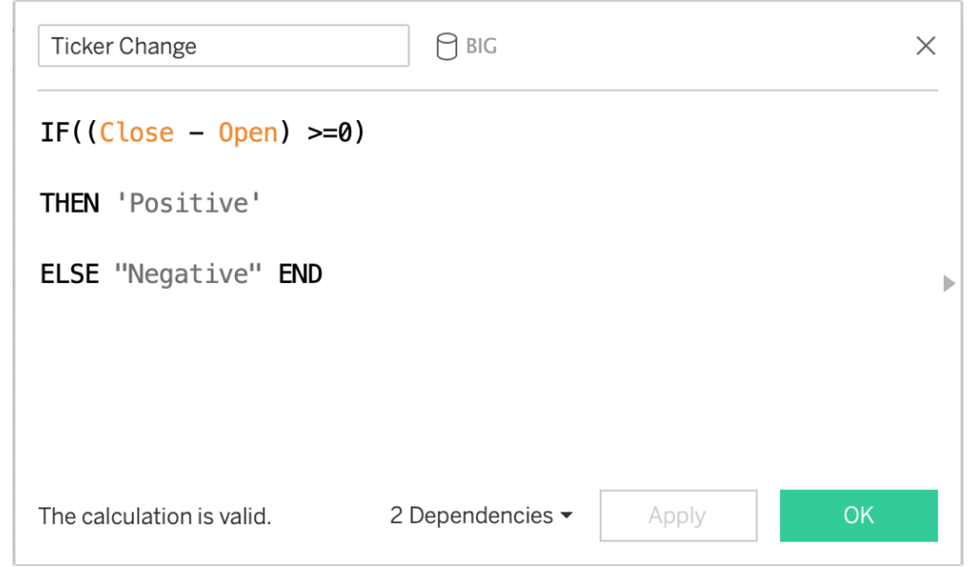
This will be used to determine the ticker colour.
This will be used to colour the body of the candles green or red later.
Candle Length
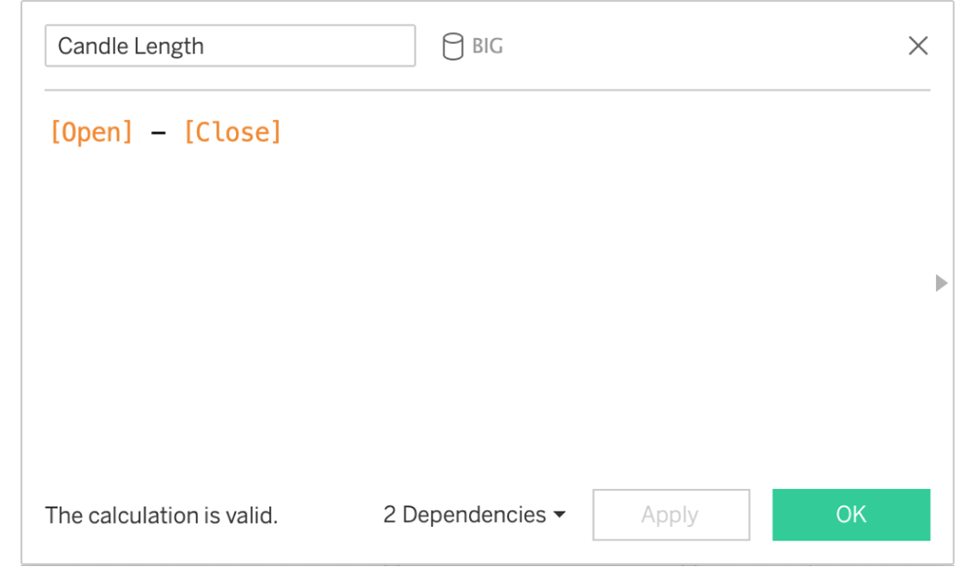
This will be how to size the Gantt Bar
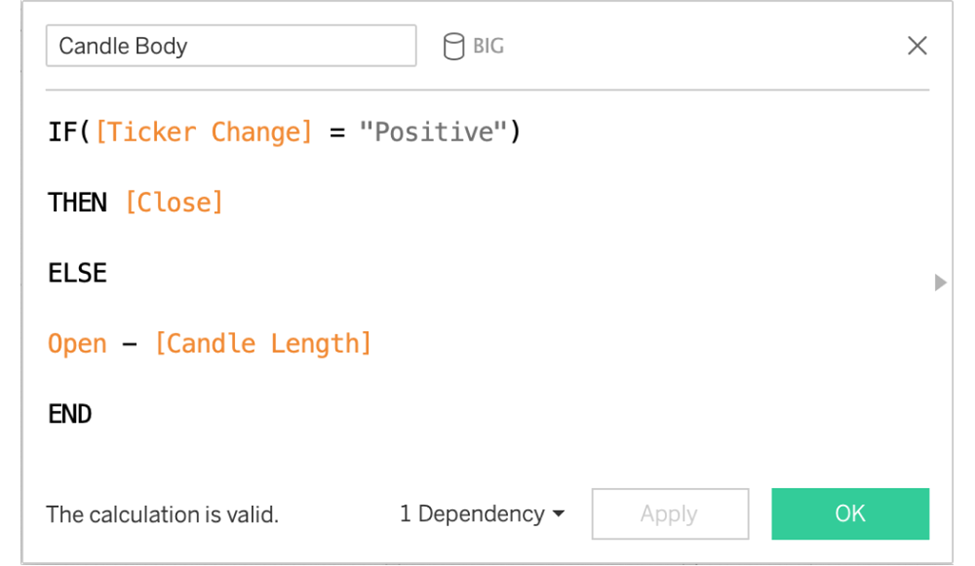
Candle Body
This is where to begin drawing the Gantt Bar. Pay attention to the adjustment at the bottom that has to be made for the negative changes.
Let’s build this chart for the Year 2020, Week 13.
1. Drag DAY(Date) to the columns shelf. It should be a blue discrete pill.
2. Drag YEAR(Date) to Filters shelf. Choose 2020.
3. Drag WEEK(Date) to Filters shelf. Choose Week 13.
4. Double-click the Measure field Close in the data pane to add it to the view.
5. Double-click the Measure field Open in the data pane to add it to the view.
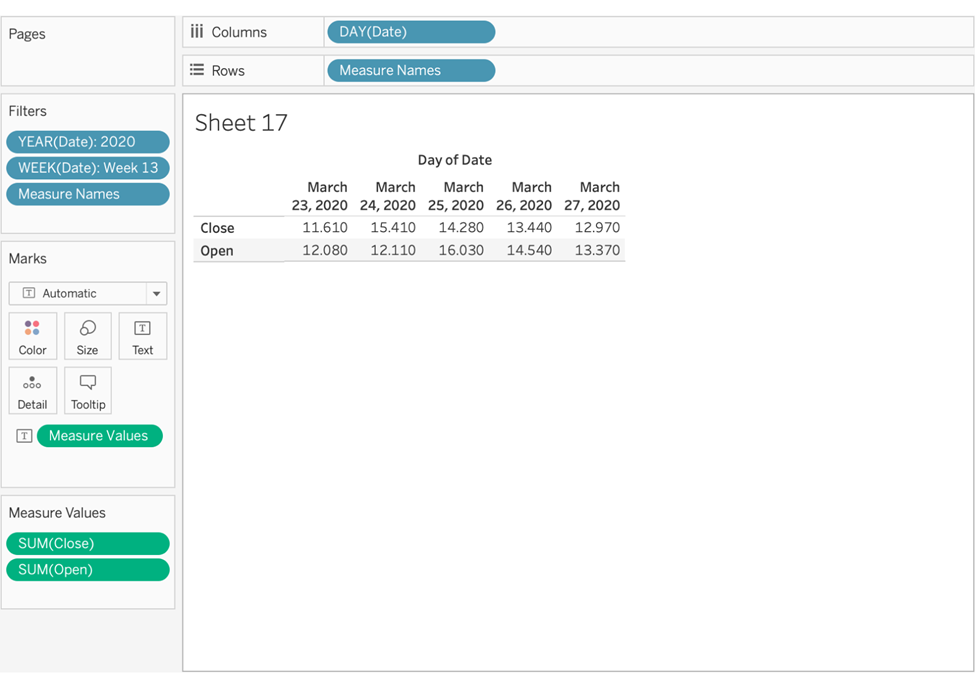
Notice that it generates Measure Names and Measure Values:
Measure Values (Green Pill) and Measure Rows (Blue Pill) must switch places.
6. Drag Measure Names from the Rows to the Marks card and drop it on Path.
7. Drag Measure Values from the Marks card to the Rows shelf.
You should have a Line chart.
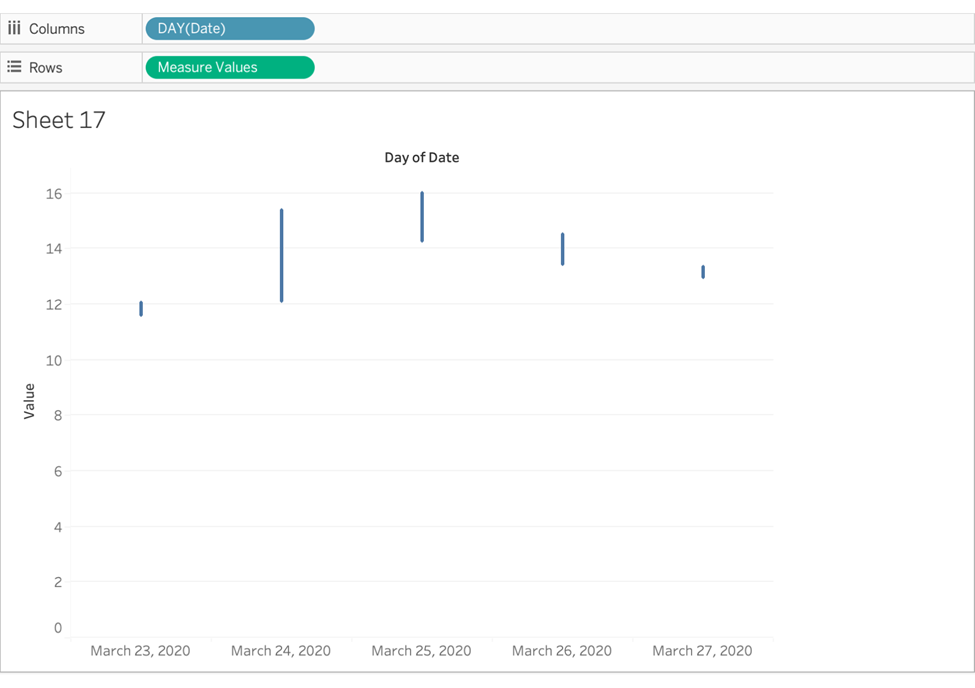
8. For Measure Names (on the Marks card), drop it onto Path.
Now, let’s make the Candlestick body.
9. Drag the Candle Body to Rows. Click on its Green Pill to select it, forcing the Marks card to update itself to this measure.
10. On the Marks card for Candle Body, change the chart type to Gantt Bar.
11. Drag Candle Length to Size.
12. Drag Ticker Color to Color on the Marks card.
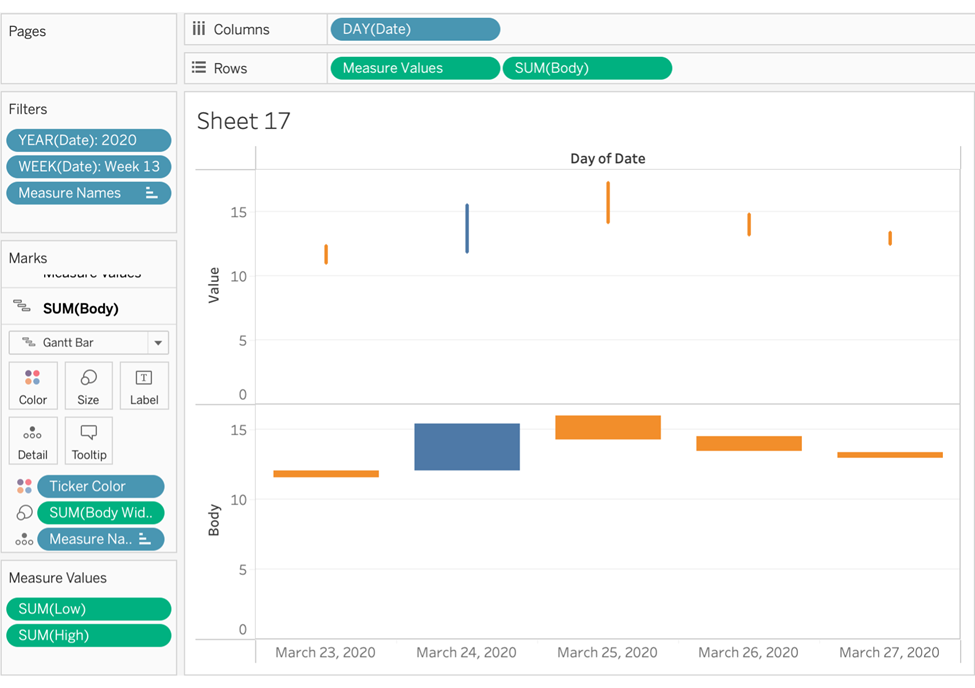
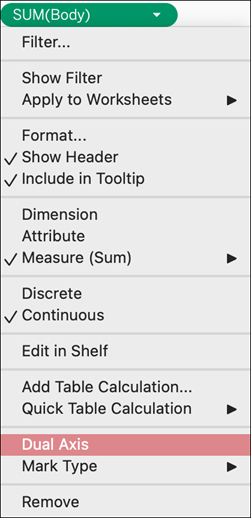
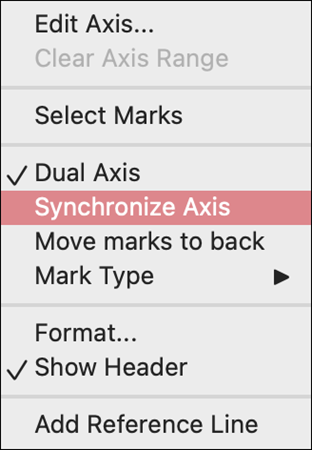
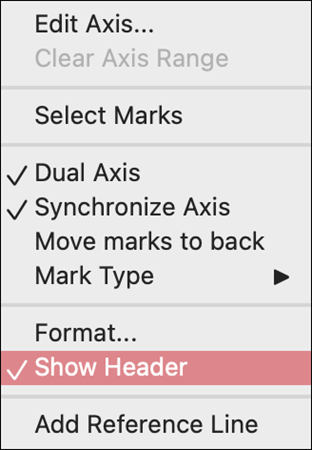
13. For Candle Body on the Rows shelf, click the dropdown arrow and select Dual Axis.
14. Right-click on the right axis and select Synchronize Axis. Right-click on it again, and deselect Show Header.
We are very close to the final look. It would be best if you now had something similar to this:
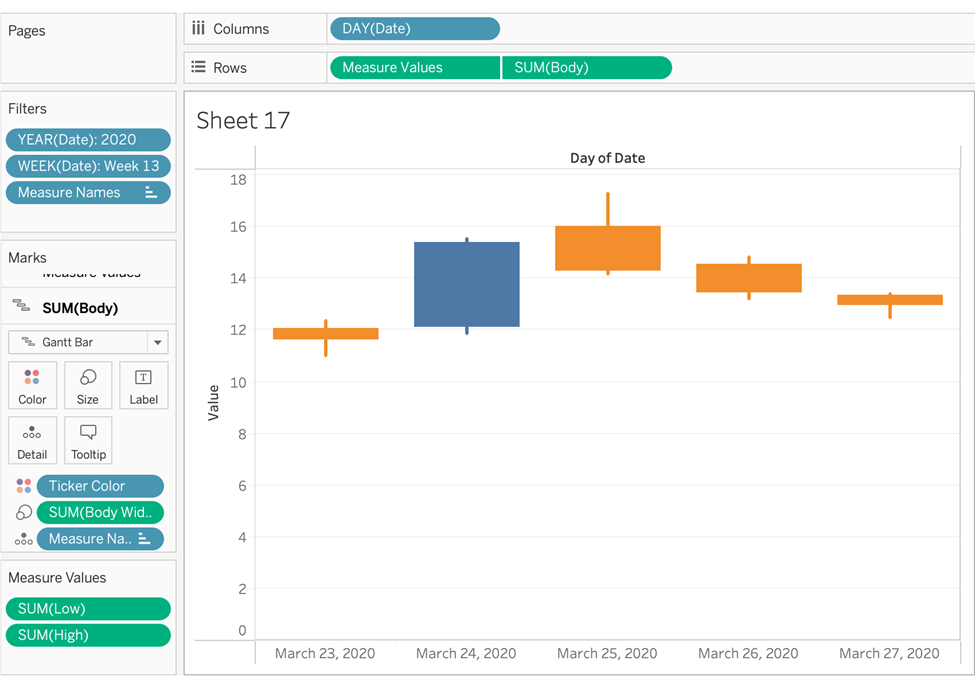
Chart Formatting
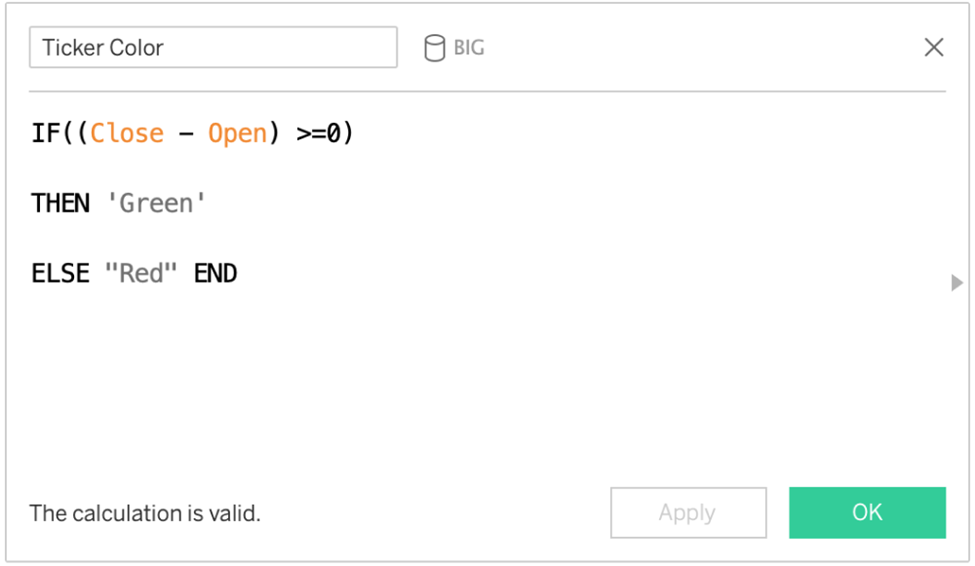
1. Change the colour of the candle body. Candle body uses the calculated field “Ticker Color”. We have chosen #00B53D (green) for a positive change and #E85351(red) for a negative change.
2. Change the colour of the wick. Here it is white, but in colour as you wish.
2. Change the chart background color to #282828.
3. Delete the Y-axis title.
4. Row Gridlines should be dotted #3B3B3B.
5. There should be no Column Gridlines, Axis Rulers, and Zero Lines.
6. All text (axis, title) should be a light grey #C0C0C0
7. Hide Field Labels for Columns if it is still showing.
Well, it is done! You’ve made a Tableau Candlestick chart!
Candlesticks are irreplaceable for visualizing stock market data. Which means… If you generally need this type of visualization, you are now much more powerful! For other advanced charts in Tableau, check out this guide.
If you want to see a tutorial for an advanced Tableau chart that we have not completed yet, let us know!