Embark on a journey through the world of financial clarity as we explore five captivating Tableau balance sheet examples (exciting!). Renowned for its robust analytics, Tableau transforms complex data into digestible insights, revolutionizing the balance sheet process. From start ups to established corporations, these examples illuminate financial standings and highlight the tool’s versatility.
Related posts:
- Tableau Income Statement Dashboards – A Guide to Making Amazing Income Statements
- 7 Great Tableau Income Statement Examples
- 13 Amazing Tableau Financial Dashboards for Financial Mastery
- 6 Amazing Tableau Bank Dashboard Examples
- Uncover Hidden Threats: How a Fraud Dashboard Can Transform Your Business Security
- 5 Powerful Revenue Dashboard Examples to Track & Boost Your Business Growth
Table of Contents
#1 Tableau Balance Sheet Examples

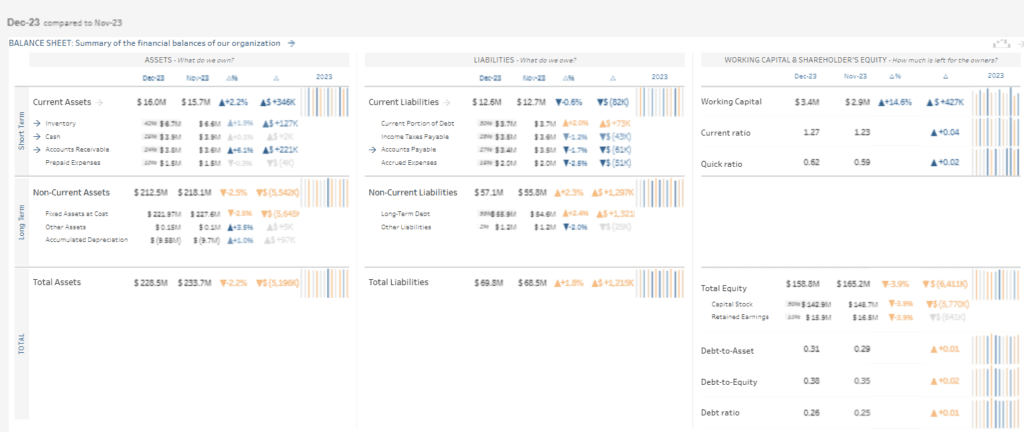
This Tableau balance sheet dashboard offers a comprehensive financial overview of an organization by comparing balance sheet data across December 2023 (Dec-23) and November 2023 (Nov-23). Structured into three main sections: Assets, Liabilities, Working Capital, and Shareholders’ Equity, it serves as a prime Tableau balance sheet example.
The Assets segment details current and non-current assets, showcasing the changes in value and percentage, which is pivotal for balance sheet visualization. The Liabilities portion is similarly structured, presenting contemporary and non-current liabilities with their respective variations and percentages. Items like ‘Cash’ and ‘Long-Term Debt’ are included, providing a granular view of the balance sheet’s movement.
In the Working Capital and shareholder’s Equity segment, this Tableau balance sheet viz highlights essential financial ratios and metrics, including Working Capital, Current Ratio, and Quick Ratio, paired with Total Equity consisting of Capital Stock and Retained Earnings. Additionally, it displays leverage ratios such as Debt-to-Asset and Debt-to-Equity with visual bar graphs tracking the trends for the year.
This Tableau balance sheet visualization is particularly beneficial for financial analysts, accountants—who often utilize Tableau for such financial insights—company management, and investors. It is a Tableau balance sheet example that demonstrates the entity’s monthly economic evolution, solvency, and liquidity, all of which are integral for strategic planning and performance assessment.
#2 Tableau Balance Sheet Examples

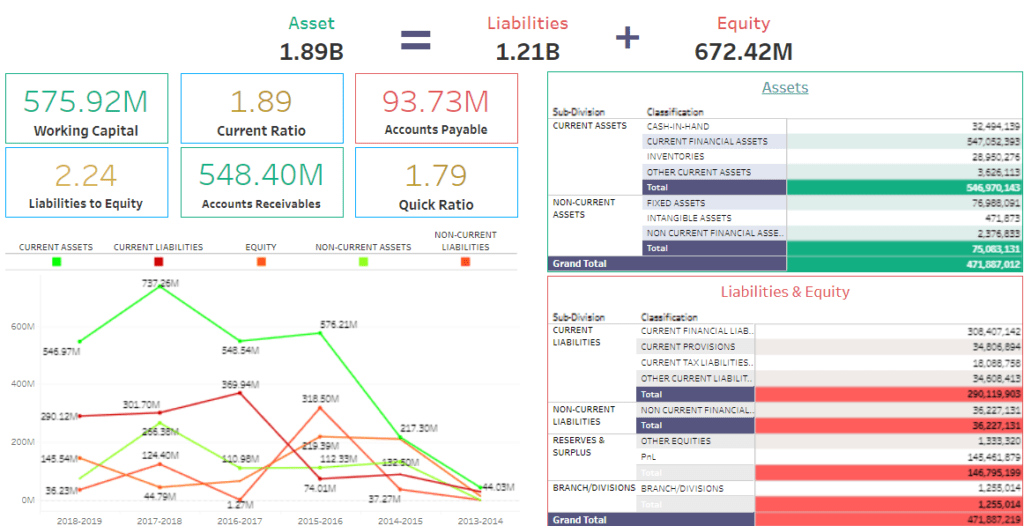
This Tableau balance sheet dashboard provides a detailed financial snapshot that focuses on the assets, liabilities, and equity of a business. As a Tableau balance sheet example, it delineates vital metrics: total assets at $1.89 billion, liabilities at $1.21 billion, and equity at $672.42 million. Essential financial ratios, such as Working Capital ($575.92 million), Current Ratio (1.89), and Quick Ratio (1.79), are prominently featured, granting a clear balance sheet visualization and insights into the company’s liquidity and short-term financial stability. Accounts Receivables are $548.40 million, with Accounts Payable at $93.73 million, both vital for cash flow management.
Featuring tableau balance sheet examples over time, the dashboard provides a line chart breakdown of assets and liabilities, aiding in trend analysis. Current assets, despite fluctuations, exhibit an upward trend, while current liabilities display steadiness.
The balance sheet viz in Tableau further categorizes assets into cash-in-hand, inventories, and non-current assets such as fixed and intangible assets. The Liabilities & Equity section includes current financial liabilities, provisions, non-current liabilities, and equities.
Accountants who frequently use Tableau, financial analysts, investors, and company management will find these Tableau balance sheets invaluable for assessing financial health and informing decisions concerning liquidity, asset management, and long-term financial strategy.
#3 Tableau Balance Sheet Examples

This Tableau balance sheet dashboard provides a nuanced financial analysis for three entities—Ruth’s Hospitality Group (RUTH), Sprouts Farmers Market (SFM), and Wendy’s Company (WEN)—spanning 2019 to 2021. It incorporates a Tableau balance sheet summary (in thousands), pivotal financial ratios, and a comparison of market-to-book value.
The Tableau balance sheet example highlights each corporation’s current assets, liabilities, and equity, with a visible increase in ‘Cash and cash equivalents’ and ‘Accounts receivable’ over the period for all businesses, signifying a potential upsurge in liquidity and credit sales.
After the balance sheet, bar charts articulate financial ratios such as ‘Current Assets to Current Liabilities,’ ‘Current Liabilities to Total Liabilities,’ and ‘Total Liabilities to Total Equity.’ These ratios are integral to the balance sheet viz, providing swift insights into the firms’ liquidity, leverage, and financial configuration.
To the right, the dashboard features a ‘Market Value to Book Value’ bar chart, which infers the market valuation against the book value of the companies’ equity. Additionally, the ‘Total Equity’ visualization captures the net worth of each company, showing stability or growth over the tracked years.
Investors, accountants who regularly utilize Tableau for such insights, financial analysts, and company managers will find these Tableau balance sheet examples invaluable. The dashboard is a balance sheet visualization tool that offers a snapshot of fiscal health, trends over time, and comparative market standing—all essential for investment strategy, strategic planning, and performance evaluation.
#4 Tableau Balance Sheet Examples

This Tableau balance sheet dashboard offers an analytical overview of XYZ Company for 2019, tracing the progression of total assets and net income from 2013 to 2019. It features a pair of line graphs at the top, illustrating trends in total assets and net income, paired with a comprehensive Tableau balance sheet example to the right, delineating the company’s assets, liabilities, and equity.
The ‘Total Assets Over Time’ visualization reveals a generally ascending trend from $337K in 2013 to $445K in 2019, with a slight regression in 2017. The ‘Net Income Over Time’ chart displays fluctuations, including a high of $16K in 2013, a downturn, a resurgence in 2017, and a descent to $14K in 2019.
Detailing the company’s financial health, this breakdown includes asset categories like cash and accounts receivable and inventory—providing a transparent balance sheet viz. Liabilities are also addressed, showing accounts payable and notes payable, while the equity segment displays common stock and retained earnings figures.
For financial analysts, accountants—many of whom utilize Tableau for economic assessments—investors, and company executives, this Tableau balance sheets dashboard is indispensable. It assists in monitoring growth, evaluating financial robustness, and guiding strategic decisions regarding investment and corporate governance.
#5 Tableau Balance Sheet Examples

This Tableau balance sheet dashboard offers an analytical overview of XYZ Company for 2019, tracing the progression of total assets and net income from 2013 to 2019. It features a pair of line graphs at the top, illustrating trends in total assets and net income, paired with a comprehensive Tableau balance sheet example to the right, delineating the company’s assets, liabilities, and equity.
The ‘Total Assets Over Time’ visualization reveals a generally ascending trend from $337K in 2013 to $445K in 2019, with a slight regression in 2017. The ‘Net Income Over Time’ chart displays fluctuations, including a high of $16K in 2013, a downturn, a resurgence in 2017, and a descent to $14K in 2019.
Detailing the company’s financial health, this breakdown includes asset categories like cash and accounts receivable and inventory—providing a transparent balance sheet viz. Liabilities are also addressed, showing accounts payable and notes payable, while the equity segment displays common stock and retained earnings figures.
For financial analysts, accountants—many of whom utilize Tableau for economic assessments—investors, and company executives, this Tableau balance sheets dashboard is indispensable. It assists in monitoring growth, evaluating financial robustness, and guiding strategic decisions regarding investment and corporate governance.
Check out our blog for more examples of financial dashboards!


