Tableau and Figma: Recently, we worked on a project where the client wanted a financial dashboard. This dashboard was to look good and work well on smartphones and desktop computers. The client showed us some app designs they were fond of, and we noticed all these designs had rounded containers and a nav bar.
While creating a similar design, we discovered Figma, an app for crafting many unique visualizations (“vizzes”). We also realized Figma was popular in the “viz of the day” section on Tableau Public.
So, let’s chat about Figma, how to use it, and check out some neat examples we found on Tableau Public.
What’s Figma?
Figma is a user-friendly online tool for designing interfaces. It can also be used offline and is available for Mac and Windows users. It’s great for making beautiful dashboard backgrounds, especially using a Figma background in Tableau.
How to Use Tableau and Figma Together?
Design your background image in Figma first, then add your graphs and containers. If you use containers, it makes the process smoother. Build your dashboard, take a screenshot, and then design the template.
Remember to set the Figma-created image as the background for your dashboard, placing it behind your graphs and containers.
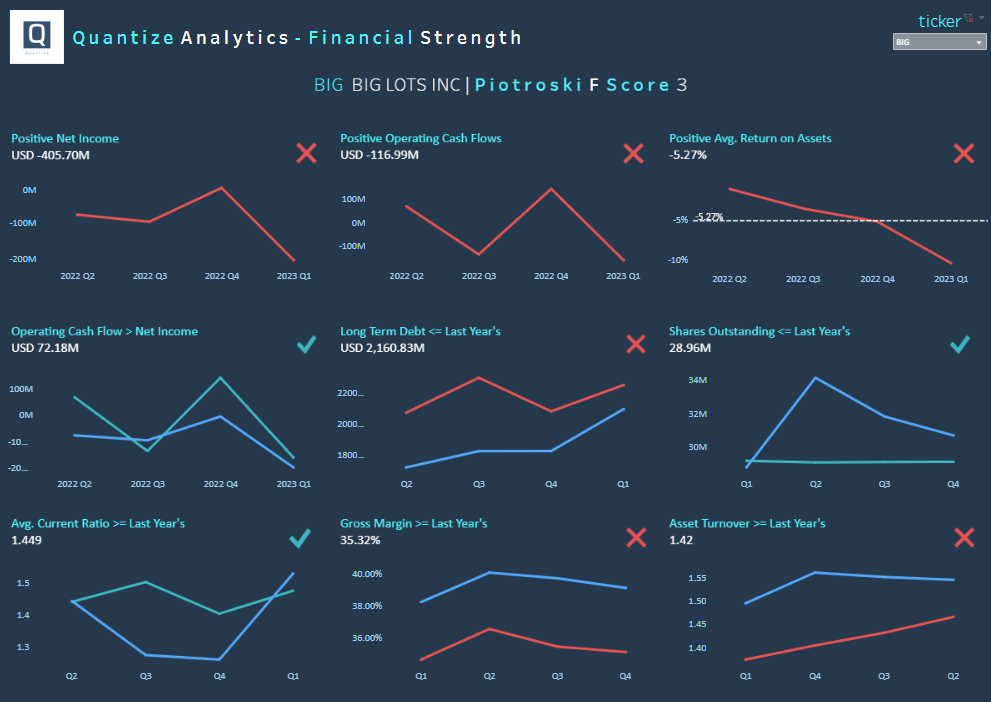
Existing Dashboard
The dashboard is operational, yet it needs some extra flair. This will be done using Tableau and Figma.
The challenges with the dashboard are:
- The starting point of one dashboard element and the ending of another are ambiguous.
- The header doesn’t align well with the overall dashboard.
- The logo appears as if it’s copied and pasted.
- The dashboard’s overall branding is lacklustre and needs improvement.
Solution – Using Pre Made Branded Templates in Figma
Here are two screenshots of dashboard templates, each featuring a navigation bar on the left and dashboard contents on the right. They are available in two colour variations: light and dark.
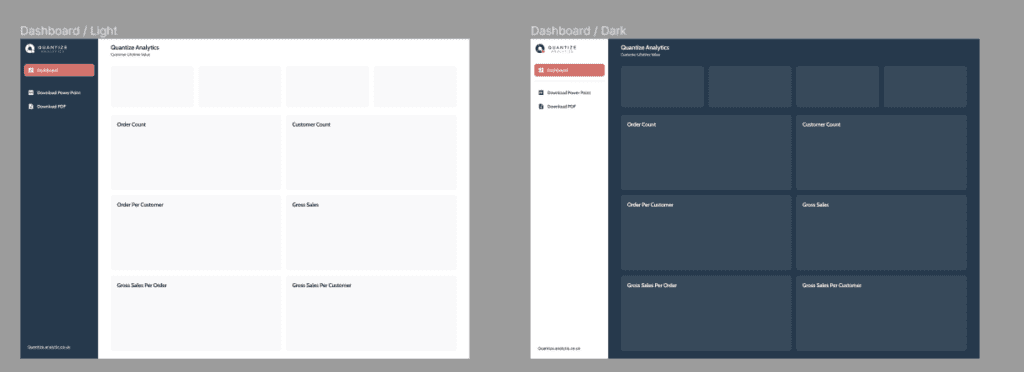
These templates, designed to align with Quantize Analytics’ brand, offer flexibility for reuse. With minimal adjustments to the design shapes, these templates can effortlessly be customized to accommodate your client’s brand while maintaining the integrity of their existing dashboard structure.
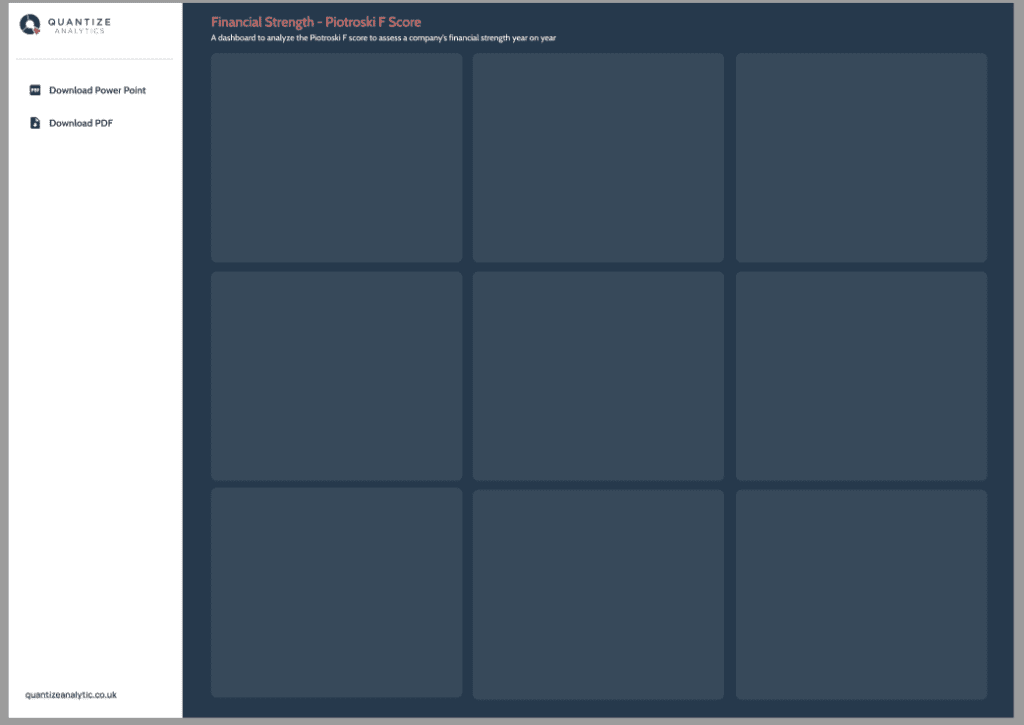
We can see here an empty Figma background where we have replicated the three-by-three grid of the dashboard. All we have to do now is insert this into the dashboard’s background of the existing dashboard.
The fusion of the original dashboard with a background template designed in Figma yields a final product that exudes a clean, professional aesthetic, effectively embodying a branded dashboard of superior quality.
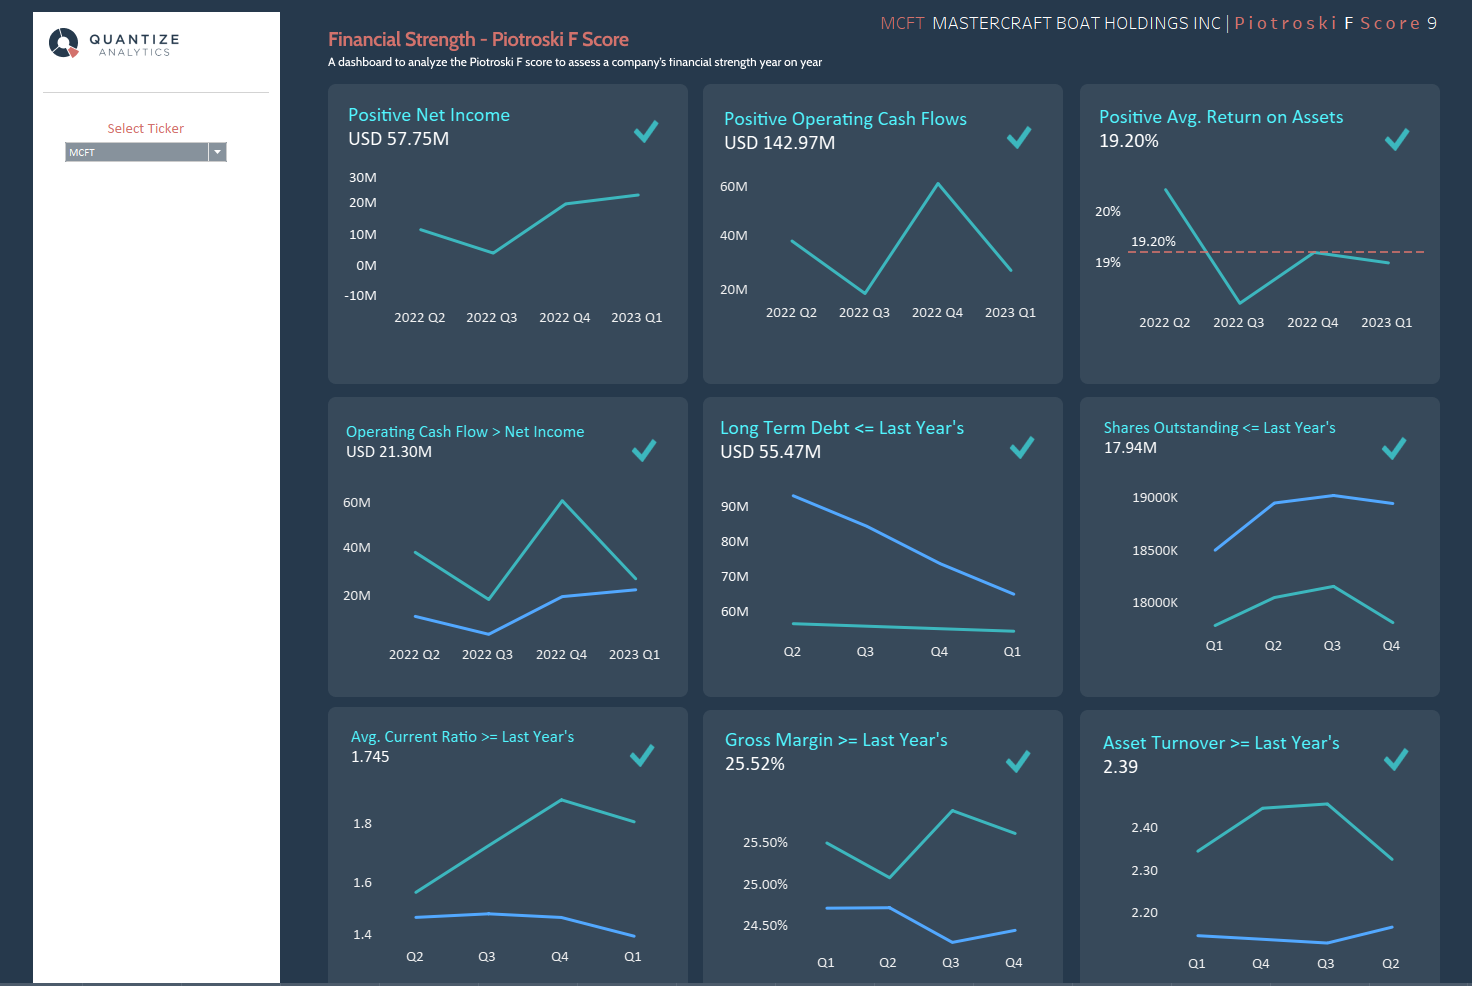
Tableau and Figma Summary
- The client requested a financial dashboard optimized for both smartphones and desktop computers.
- Client preferences included rounded containers and a nav bar, as observed in their designs.
- The design tool Figma was discovered and utilized for creating visualizations.
- Figma is popular for crafting dashboard designs, as Tableau Public’s “viz of the day” section observed.
- Figma is user-friendly, accessible on Mac and Windows, and ideal for creating dashboard backgrounds for Tableau.
- The design process involves creating a background image in Figma, and then adding graphs and containers.
- The existing dashboard was functional but needed clarity between elements, alignment, logo presentation, and overall branding.
- Figma templates that align with Quantize Analytics’ brand are customizable and reusable for different brands while maintaining dashboard structure integrity.
- The final dashboard, a combination of the original and a Figma-designed background, presented a clean and professional appearance, encapsulating superior branded quality.