A well-designed social media dashboard provides a clear, organized view of key performance metrics, enabling teams to make informed decisions and adjust strategies based on real-time data. This blog showcases seven compelling social media dashboard examples, each tailored to highlight different aspects of social media performance, from engagement and reach to audience demographics and content effectiveness.
Related posts:
- Best 5 CRM Dashboard Examples to Boost Your Customer Strategy!
- Google Analytics with Tableau: 5 Great Examples
- 8 Amazing Tableau eCommerce Dashboard Examples
- 5 Powerful Tableau Survey Analysis Dashboards: Unlock the Full Potential of Tableau for Survey Data
- 7 Amazing Customer Dashboard Examples for Actionable Customer Insights
- 5 Stunning Churn Dashboards That Boost Customer Retention Strategies
Whether you’re a social media manager, content strategist, or digital marketing analyst, these examples can serve as valuable tools for understanding how various metrics interact and contribute to your overall social media goals. These dashboards enhance transparency across teams and streamline the reporting process, making complex data more accessible and actionable.
Table of Contents
#1 Social Media Dashboard Examples – Social Marketing Tracker
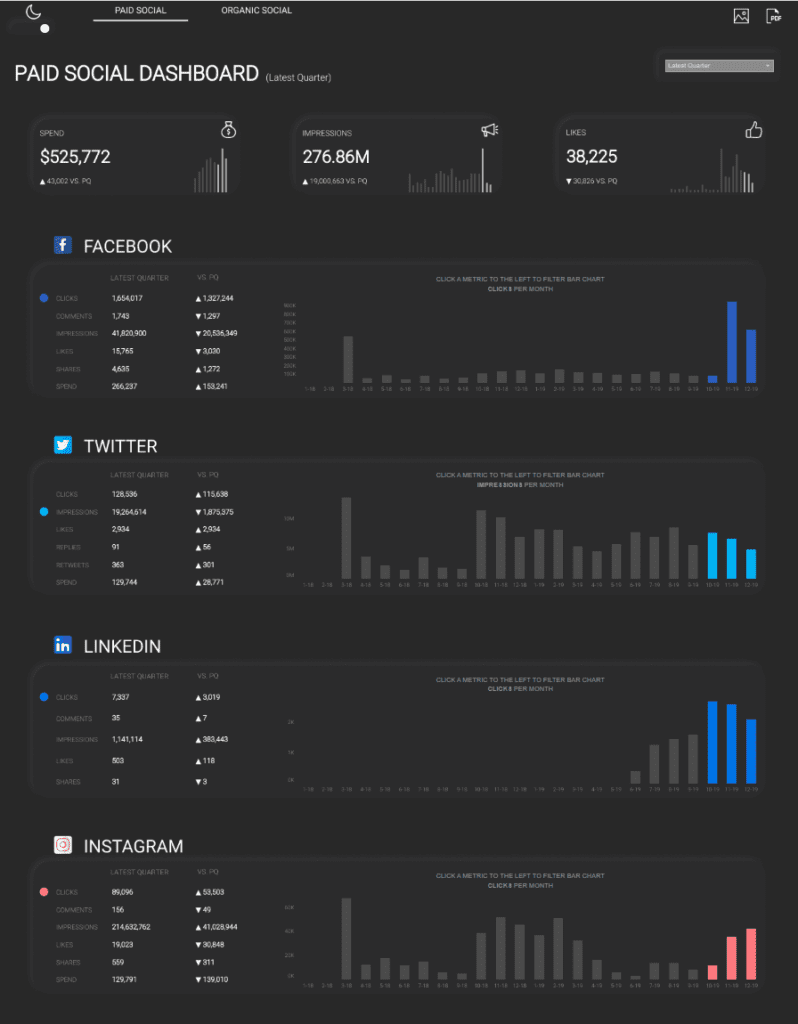
This Paid Social Dashboard provides an in-depth look at key performance metrics across multiple social media platforms, including Facebook, Twitter, LinkedIn, and Instagram. As a social media analytics dashboard, it aggregates essential metrics for the latest quarter, such as spend, impressions, and likes, with comparisons to the previous quarter (PQ) to showcase trends and growth.

The top section of this social media dashboard summarizes total spending, impressions, and likes with concise numerical displays and line graphs that visualize trends over time. Each social media platform has its section presenting metrics such as clicks, comments, impressions, likes, shares, and spending, all with quarter-over-quarter comparisons.
This social media metrics dashboard employs various chart types to display data visually. It uses line charts for overall trends, bar charts to show the distribution of clicks and impressions by month, and a simple numerical display with arrows to indicate increases or decreases in metrics. Users can interact with this dashboard for social media monitoring by selecting specific metrics to filter the bar chart data for further insights.
This social media reporting dashboard is handy for managers, digital marketers, and analysts who want to track paid social media performance. It helps identify platform-specific trends, assess campaign effectiveness, and make informed decisions on where to allocate future advertising budgets. It stands out among social media dashboard examples as a comprehensive tool for monitoring.
#2 Social Media Dashboard Examples – Social Media Dashboard
The RWFD Twitter Dashboard provides a detailed overview of Twitter performance metrics over a specified period, from June to October 2020. As a social media metrics dashboard, it covers critical metrics like impressions, engagements, hashtag clicks, likes, replies, and retweets. Each metric includes a percentage indicator showing the change from a previous period and a line graph that visually represents trends over time.

This social media analytics dashboard uses a range of visualizations to make data analysis intuitive. Bar charts display tweet distribution by weekday and hour, helping users understand when they tweet most often and identify optimal days and times for engagement. The engagement rate by day and time is presented as a heatmap, which offers a clear view of peak engagement periods throughout the week. Additionally, a line chart shows weekly impressions, helping track trends, and a bar chart lists the top 10 tweets by impressions for a quick view of high-performing content.
This social media monitoring dashboard is especially beneficial for social media managers and content strategists who focus on Twitter. As a comprehensive social media reporting dashboard, it allows them to identify engagement patterns, determine high-performing content, and optimize posting schedules for better audience reach and engagement. It is one of the effective social media dashboard examples for maximizing impact on Twitter.
#3 Social Media Dashboard Examples – Social Media Performance Dashboard
This Twitter/X Performance Dashboard for September 2023 provides a comprehensive overview of key metrics, including impressions, likes, retweets, and comments, making it a valuable social media analytics dashboard. Each metric includes the current month (CM) value, previous month (PM) comparison, and percentage change, with line graphs displaying monthly trends over the past year. These line charts make it easy to track the progression of each metric, highlighting significant changes or patterns in this social media reporting dashboard.

This social media metrics dashboard features a flow chart in the centre that breaks down post interactions by post type and content category. This chart shows which content types (such as links, photos, and videos) and categories (promotional versus product posts) drive the most engagement, letting users see which content formats are most effective for audience interaction. Additionally, a heatmap-style bubble chart in the bottom right corner shows interaction by time and day, providing insights into the optimal times for audience engagement.
This social media monitoring dashboard is particularly useful for social media managers, digital marketers, and analysts who focus on Twitter/X. By offering clear visuals on post-performance, content type effectiveness, and engagement timing, it stands out among social media dashboard examples as an essential tool for refining content strategies and maximizing audience engagement on the platform.
#4 Social Media Dashboard Examples – Social Media Engagement And Reach
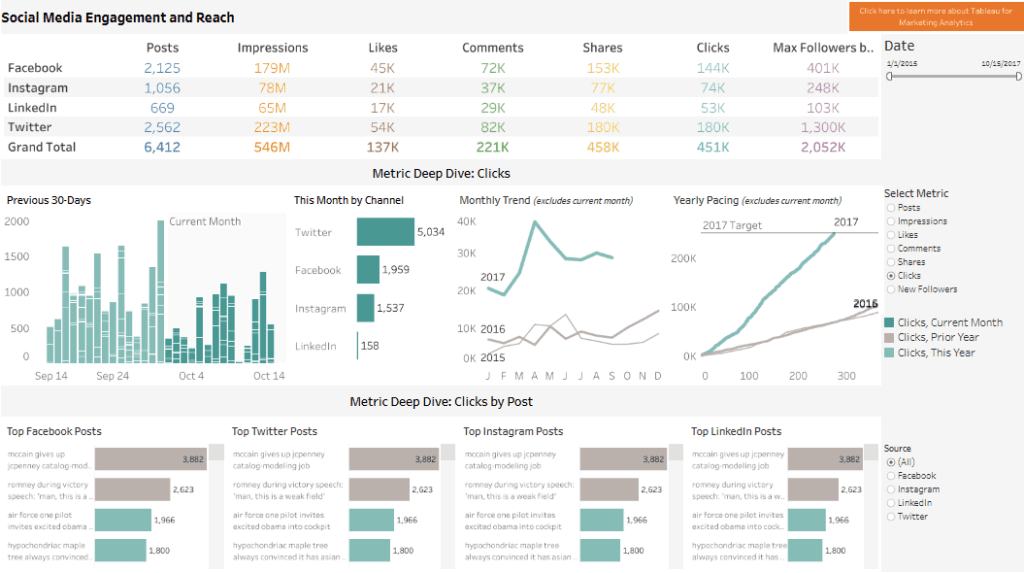
The Social Media Engagement and Reach Dashboard provides a comprehensive view of engagement metrics across major platforms, including Facebook, Instagram, LinkedIn, and Twitter. The top summary table displays metrics such as posts, impressions, likes, comments, shares, and clicks, with a total for all platforms combined. This setup makes it an effective social media metrics dashboard, providing a quick snapshot of cross-platform performance.

Further, a Metric Deep Dive section highlights clicks by post for each platform, listing the top-performing posts in terms of engagement. This makes this a valuable social media reporting dashboard for campaign analysis.
This social media monitoring dashboard is ideal for social media managers, content strategists, and marketing analysts who want to understand engagement patterns, identify high-performing content, and assess their progress towards yearly goals. It stands out among social media dashboard examples by offering clear, actionable insights.
#5 Social Media Dashboard Examples -Social Media Dashboard
The Social Media Analysis Dashboard for August 2020 provides a granular view of engagement metrics on a specific social media platform. It covers critical metrics such as likes, replies, detail expands, retweets, URL clicks, hashtag clicks, media views, and profile clicks. Each metric is presented in a separate card format with the current value and percentage changes compared to the previous month (PM), making it a practical social media metrics dashboard.

Each card includes a small line chart that tracks the monthly trend for each metric over a few months, offering a quick snapshot of changes over time. Additionally, each section highlights the top five posts for each metric, such as the top five liked tweets or clicked URLs, along with the percentage of engagement each achieved. This layout lets users quickly identify which posts drive the most engagement across different areas.
This social media analytics dashboard is especially beneficial for social media managers, content creators, and digital marketing analysts who require detailed insights into user interactions and engagement levels. As a comprehensive social media reporting dashboard, it’s ideal for tracking performance trends, identifying successful content, and understanding which interactions resonate most with audiences. This social media monitoring dashboard is one of the practical social media dashboard examples for optimizing content strategies based on engagement insights.
#6 Social Media Dashboard Examples – Social Media KPIs
The Sample Social Media Dashboard overviews critical performance metrics, focusing on video content analytics. Key metrics include total watch time, average watch time, total video views, unique views, average views per viewer, impressions click-through rate (CTR), audience retention, engagement, subscribers gained and lost, estimated revenue, and monetized playbacks. Each metric is displayed with a value, a trend line over recent months, and a percentage change compared to the prior month, making this a highly effective social media metrics dashboard.

The line charts within each metric box allow users to quickly assess monthly trends, highlighting increases or decreases in engagement and performance. This type of visualization is beneficial for spotting patterns or changes in viewer behaviour, such as watch time drops or engagement spikes, which can reveal content preferences or seasonal shifts.
This social media analytics dashboard is ideal for social media managers, content creators, and digital marketing professionals who focus on video content. It serves as a valuable social media reporting dashboard by providing detailed insights into viewer behaviour, engagement, and revenue. Additionally, as a dashboard for social media monitoring, it aids in strategic planning by offering a clear view of performance across essential video metrics. This design is an excellent addition to social media dashboard examples for optimizing content based on in-depth audience analytics.
#7 Social Media Dashboard Examples – Social Media Monthly Report
The Social Media Report for July 2020 provides a detailed overview of Twitter performance metrics. It covers a range of metrics, including tweets posted, average engagement rate, impressions, total engagements, and top tweets. This social media dashboard utilizes various chart types to deliver insights, making it an effective social media reporting dashboard.

A bar chart in the upper left tracks tweets posted daily, allowing users to observe content distribution throughout the month. The total impressions and engagement metrics are shown with vertical bar charts to track monthly performance. A heatmap displays engagement rates by day and hour, helping users identify peak engagement times. The “Top Tweets” section highlights high-performing posts with metrics such as impressions, likes, retweets, and engagement rate, ideal for pinpointing successful content.
This social media analytics dashboard also includes a trending hashtags section, with bar charts displaying impressions and clicks for each hashtag, offering insights into audience interests. The engagement breakdown section lists detailed metrics, including detail expands, likes, user profile clicks, and app opens, enabling social media managers to understand specific engagement types.
This social media monitoring dashboard is valuable for social media managers, content creators, and analysts who aim to optimize posting schedules and content strategies. It provides in-depth insights into performance and engagement trends, making it one of the most insightful social media dashboard examples.
The seven social media dashboard examples discussed in this blog illustrate the power of visualizing data in an intuitive, accessible way. From monitoring engagement rates to tracking impressions and audience growth, each dashboard provides unique insights that help businesses optimize their social media strategies.
These social media analytics dashboards support decision-making by turning raw data into meaningful insights, ensuring teams can quickly assess what’s working and what needs adjustment. For professionals who prioritize data-driven social media reporting, these dashboards provide the structure needed to stay ahead in a competitive landscape. As you explore these examples, consider how customizing a social media metrics dashboard to suit your specific goals can lead to more effective social media monitoring and impactful results.


