In this blog post, we explore 13 outstanding profitability dashboards that showcase different ways to monitor financial performance. From high-level executive summaries to detailed product and regional breakdowns, these profit and loss dashboards offer actionable insights that businesses can use to enhance profitability. Each example highlights unique data visualization techniques, helping you understand how to design and implement an effective dashboard for your organization. Let’s dive into these inspiring examples and see how they can transform financial decision-making.
Table of Contents
#1 Profit Dashboard – NCAA Profits KPI Dashboard
This NCAA Athletic Department profit dashboard visually represents revenue, expenses, and profits across different conferences from 2005 to 2017. The profit and loss dashboard presents key financial figures 2015, with a breakdown of yearly and long-term percentage changes.
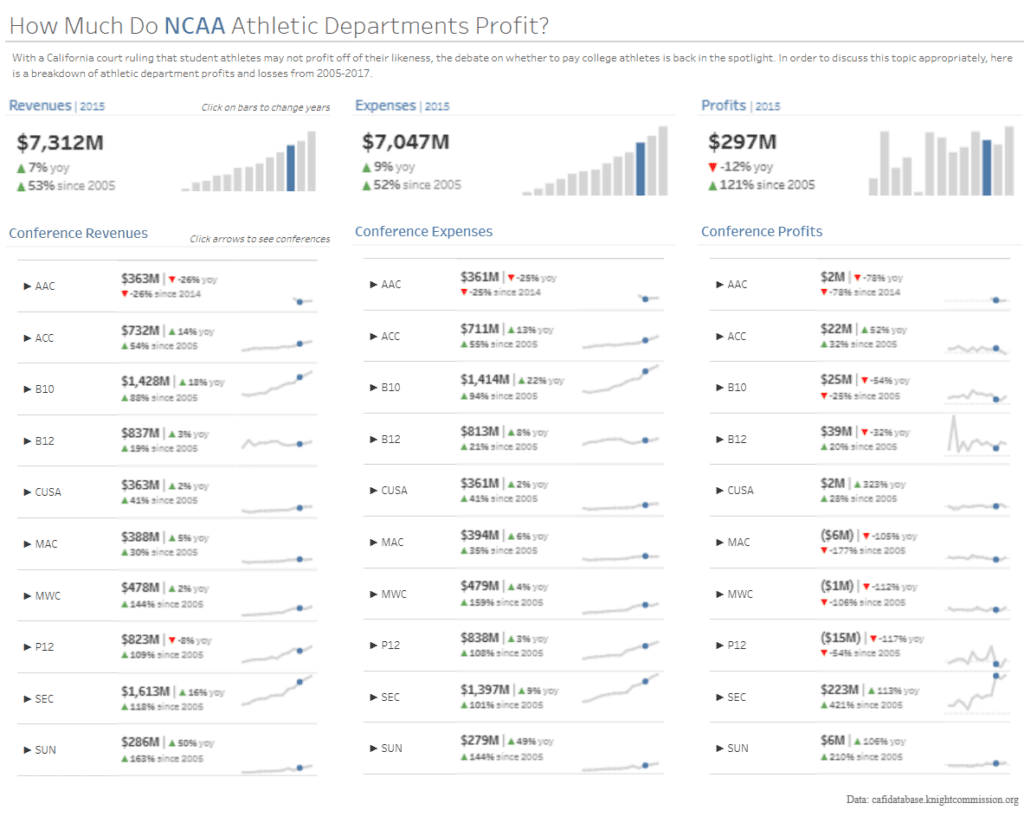
Chart Types Used
- Bar Charts: Used to display historical trends in revenue, expenses, and profits. Users can click on the bars to change the year and view historical data.
- Line Graphs: Each conference section includes a mini-line chart, visualizing financial trends over time.
- Key Metric Indicators: The P&L dashboard highlights prominent financial figures, such as total revenues ($7.312 billion), expenses ($7.047 billion), and profits ($297 million), with percentage changes from previous years.
Users and Decision-Making
This profitability dashboard is beneficial for multiple stakeholders:
- University Administrators: Can analyze profitability trends and make financial planning decisions regarding athletic programs.
- NCAA Officials: Can use this data to assess the overall financial health of different conferences and decide on policy changes.
- Policy Makers and Analysts: You can use this P&L dashboard to discuss whether student-athletes should be paid.
- Sports Business Investors & Sponsors: Companies considering sponsorship deals can evaluate the financial performance of different conferences.
- Media and Researchers: Journalists and academics can use the profit and loss dashboard to report on trends in college sports finances.
Benefits to a Company
- Data-Driven Decision Making: Helps universities optimize athletic budgets by identifying financial trends.
- Transparency & Accountability: Provides a clear view of how funds are allocated and used.
- Competitive Benchmarking: Allows conferences to compare financial performance and adjust spending strategies.
- Sponsorship Strategy: Helps companies and brands target financially strong conferences for investment opportunities.
This interactive profitability dashboard simplifies complex financial data, enabling users to make informed decisions.
#2 Profit Dashboard – Profit & Loss Statement
This profit and loss dashboard provides a detailed breakdown of financial performance year-to-date through June 2017. It includes key economic metrics such as gross sales, cost of goods sold, gross profit, total expenses, and net profit. Additionally, it highlights specific expense categories, including salaries and wages, depreciation, rent, office supplies, utilities, insurance, travel, maintenance, advertising, interest, and other expenses. Each metric is compared to the prior year (YTD PY) and the latest month-over-month (MoM) changes.
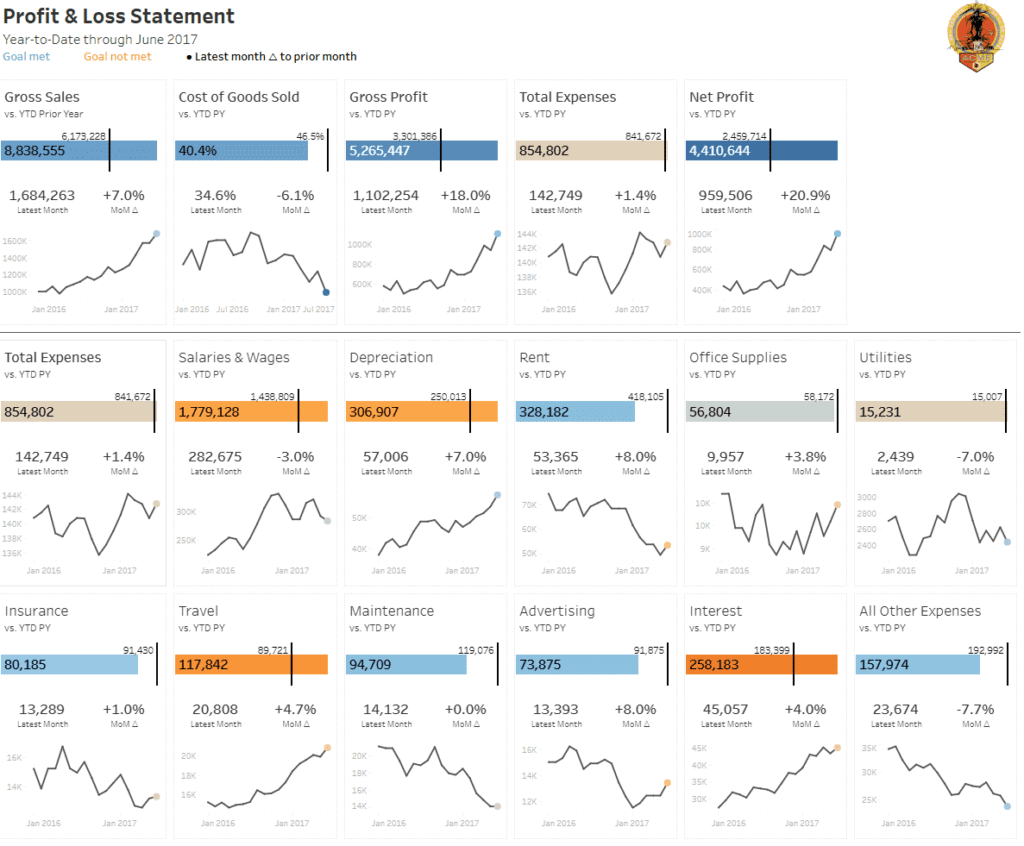
Chart Types Used
- Bar Indicators: Each key financial metric includes a horizontal bar that visually represents its performance relative to the previous year, making it easy to identify positive or negative trends.
- Line Charts: Below each key metric, a line chart illustrates the trend over time, providing insight into seasonality and fluctuations in financial performance.
- Colour Coding: Positive trends are highlighted in blue, while negative trends appear in orange, allowing for quick identification of areas that need attention.
Users and Decision-Making
This profitability dashboard is helpful for:
- Business Owners and Executives: Helps assess the company’s overall financial health and make high-level strategic decisions.
- Finance Teams: Provides insights into specific cost components and profitability trends to adjust budgets and forecasts.
- Department Managers: Can track expenses in categories such as salaries, rent, and office supplies to ensure financial efficiency.
- Investors and Stakeholders: Offers a clear view of company performance, helping evaluate investment decisions.
Benefits to a Company
- Improved Financial Oversight: Enables businesses to monitor revenue, costs, and profits in real-time.
- Cost Control: Helps identify rising expenses that may need intervention.
- Profitability Analysis: Highlights the most and least profitable areas of the business.
- Data-Driven Decision Making: Supports more informed financial planning and strategy execution.
This P&L dashboard enhances financial visibility by integrating key performance indicators into a structured profit dashboard. It ensures businesses can optimize their operations and maximize profitability.
#3 Profit Dashboard – Superstore Profit Analysis
This profit dashboard provides a comprehensive overview of financial performance for the year 2023. It presents key profitability metrics, including total profit, profit ratio, profit per customer, and profit per order. The profit and loss dashboard enables a detailed analysis of profitability across regions, states, segments, categories, and sub-categories, helping businesses identify strengths and areas for improvement.
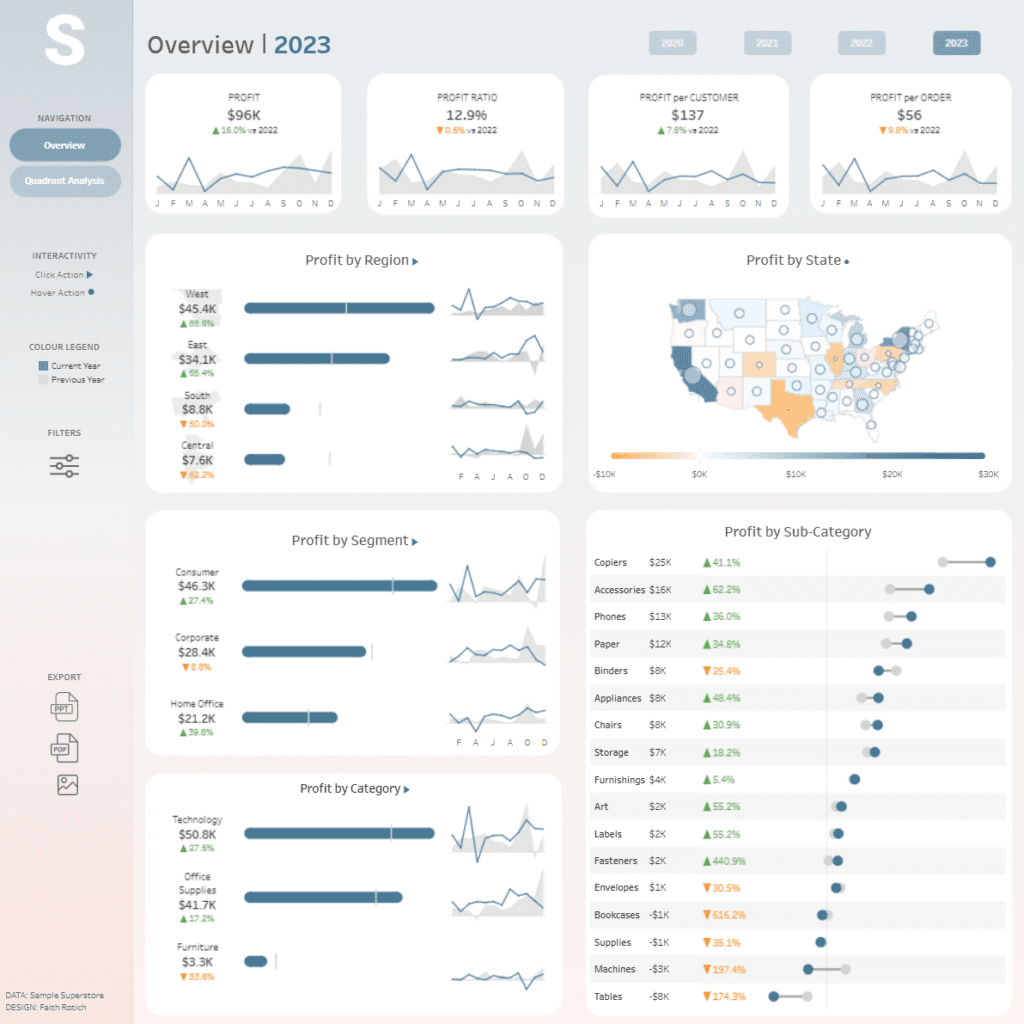
Chart Types Used
- Line Charts: Display profit trends over time, allowing users to track month-over-month variations and compare current performance to previous years.
- Bar Charts: These are used in the profit by region, segment, and category sections to highlight the relative contributions of different areas to overall profitability.
- Heat Map: The profit-by-state visualization uses colour intensity to indicate high and low-profit regions, providing a geographic view of profitability.
- Bullet Charts: These are found in the profit by sub-category section. They show actual profits alongside benchmarks, making it easy to assess performance against expectations.
Users and Decision-Making
This profitability dashboard is valuable for:
- Executives and Business Owners: Helps assess overall profitability and make high-level strategic decisions.
- Sales and Marketing Teams: These teams identify high-performing regions, segments, and categories to refine sales strategies and marketing efforts.
- Finance and Operations Teams: Tracks profitability trends to optimize pricing, inventory management, and cost control.
Benefits to a Company
- Data-Driven Decision Making: Enables businesses to make informed choices by providing clear visibility into profit trends.
- Profit Optimization: Identifies underperforming regions and segments that require strategic adjustments.
- Strategic Planning: Supports resource allocation by pinpointing the most profitable categories and customer segments.
This P&L dashboard delivers actionable insights, ensuring companies can enhance financial performance and drive sustained growth through a well-structured profit and loss dashboard.
#4 Profit Dashboard – Company Profit | Superstore Insights
This profit dashboard provides an in-depth view of company profitability by analyzing product performance, order trends, and profit drivers. The profit and loss dashboard highlights total profit, changes over time, and key product categories contributing to financial success. It also visualizes the relationship between product orders and their impact on profitability.
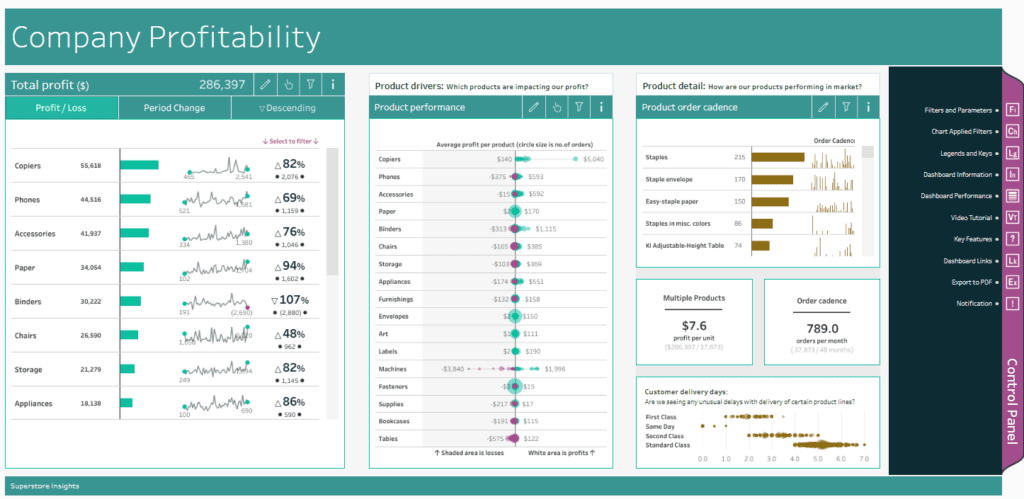
Chart Types Used
- Bar Charts: Display profit and period changes for each product category, allowing users to compare performance over time.
- Line Charts: Show profit trends for individual products, making it easy to track fluctuations and identify seasonality.
- Scatter Plots Represent product performance. The size of the circle indicates the number of orders, and the colour differentiates profit from loss.
- Bullet Charts: These are used in the order cadence section to compare order volumes across different product types.
- Dot Plots: Analyze customer delivery days to identify potential delays and their impact on profitability.
Users and Decision-Making
This p&l dashboard is valuable for:
- Executives and Business Owners: Helps assess overall company profitability and identify top-performing products.
- Product Managers: Provides insights into which products drive the most profit and generate losses.
- Sales and Marketing Teams: Identifies profitable product categories to refine sales strategies and optimize marketing campaigns.
- Supply Chain and Operations Teams: Helps track order cadence and delivery performance, ensuring efficient logistics.
Benefits to a Company
- Profitability Optimization: Identifies which products contribute most to the bottom line, allowing businesses to focus on high-margin items.
- Cost Reduction: Pinpoints loss-making products that may need price adjustments, cost-cutting, or discontinuation.
- Inventory Management: Helps balance stock levels based on order cadence and profit trends.
- Strategic Planning: Supports data-driven decision-making to maximize profits and improve overall business performance.
This profitability dashboard delivers actionable insights, enabling companies to refine strategies, improve financial health, and drive sustained growth through a well-structured profit and loss dashboard.
#5 Profit Dashboard – Profit & Loss Dashboard
This profit and loss dashboard provides a structured financial overview by displaying key revenue, expenses, profitability, and liquidity metrics. It presents comparative performance data showing percentage changes from the prior month, helping businesses monitor financial trends and make data-driven decisions.
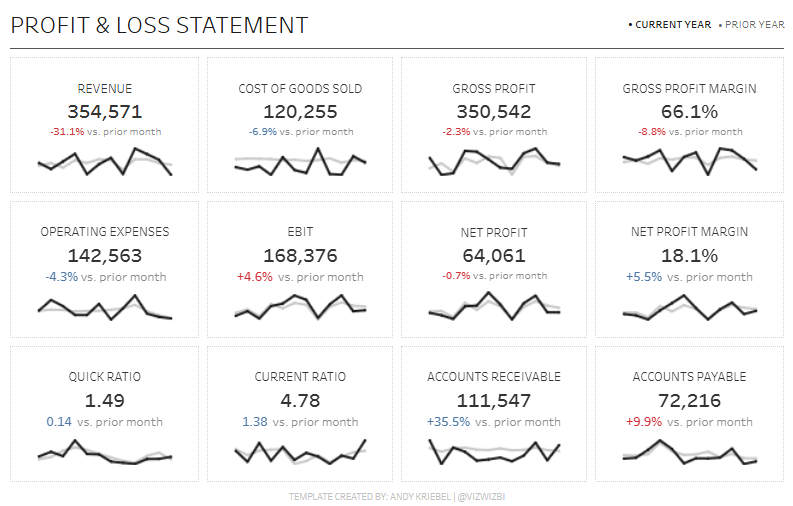
Chart Types Used
- Line Charts: Each financial metric is accompanied by a small line chart illustrating its historical trend, making it easy to identify patterns and fluctuations over time.
- Key Metric Indicators: The profit dashboard highlights key figures such as revenue, EBIT, and net profit, alongside percentage changes from the previous month to quickly assess financial performance.
- Comparative Analysis: Current-year and prior-year data are visually differentiated to track year-over-year financial trends.
Users and Decision-Making
This profitability dashboard is helpful for:
- Executives and Business Owners: Helps assess financial health, identify trends, and adjust business strategies accordingly.
- Finance and Accounting Teams: This team monitors financial ratios, such as the quick and current ratios, to ensure liquidity and effectively manage cash flow.
- Investors and Stakeholders should evaluate company performance based on EBIT, net profit, and margin to assess financial stability.
- Operational Managers help track the cost of goods sold (COGS) and operating expenses to optimize spending and improve efficiency.
Benefits to a Company
- Enhanced Financial Oversight: Provides real-time visibility into revenue, costs, and trends through a structured P&L dashboard.
- Liquidity Management: Tracks accounts receivable and accounts payable to ensure a balanced cash flow.
- Strategic Planning: Helps executives identify underperforming areas and make informed decisions to drive profitability.
- Cost Control: Highlights operating expenses and gross profit margin changes to improve cost efficiency.
This profitability dashboard delivers actionable insights, allowing companies to refine financial strategies and maintain a strong and profitable operation through a well-structured profit and loss dashboard.
#6 Profit Dashboard – Flow to Net Profit – Daimler P&L 2014-2018
This profitability dashboard provides a detailed breakdown of Daimler’s financial performance from 2014 to 2018, focusing on revenue flow to net profit. It visualizes key financial metrics such as revenue, gross profit, EBIT, EBT, and net profit, helping businesses understand how costs and expenses impact overall profitability.
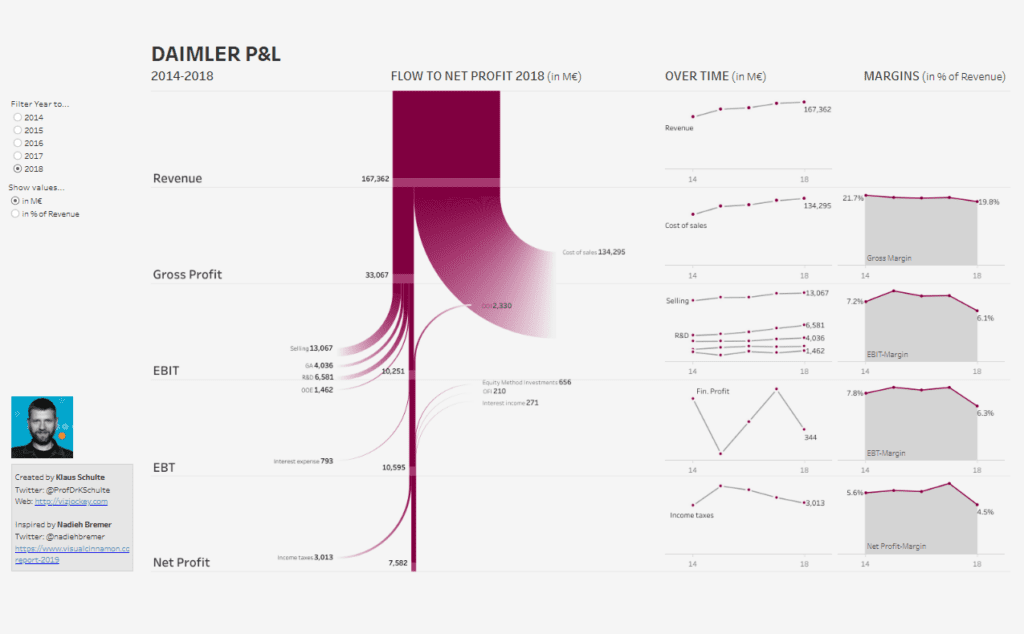
Chart Types Used
- Sankey Diagram: This primary visualization in the profit dashboard illustrates the flow of revenue through different cost components, highlighting how much of the revenue is deducted at each stage before reaching net profit.
- Line Charts: Used in the “Over Time” section, these track trends in revenue, cost of sales, selling expenses, R&D, financial profit, and income taxes over multiple years.
- Bar Charts with Area Shading: The margins section presents key profitability ratios, such as gross margin, EBIT margin, EBT margin, and net profit margin, in percentage terms, allowing for easy comparisons across years.
Users and Decision-Making
This profit and loss dashboard is valuable for:
- Executives and Financial Analysts: Helps assess long-term profitability trends and cost structures.
- Investors and Stakeholders: Provides a clear picture of revenue distribution and net profitability over time.
- CFOs and Finance Teams: Tracks financial efficiency by analyzing cost components and identifying areas to optimize expenses.
- Strategy and Planning Departments: Uses the data to refine budgeting, cost-cutting initiatives, and long-term business planning.
Benefits to a Company
- Financial Transparency: The P&L dashboard breaks down revenue allocation, helping businesses understand key cost drivers.
- Cost Control and Optimization: This process identifies significant expense areas such as selling, R&D, and taxes, enabling businesses to make cost-effective decisions.
- Performance Tracking: The dashboard monitors profitability margins over time, ensuring financial targets are met.
- Data-Driven Decision Making: Helps businesses align strategies with financial performance insights.
This profit and loss dashboard delivers an interactive and structured way to analyze financial data, ensuring better decision-making and long-term profitability growth.
#7 Profit Dashboard – Part A – Profit & Loss Statement
This profit and loss dashboard provides a comprehensive financial overview for September 2022, comparing actual performance against forecasted figures. It tracks key income and expense metrics and offers a detailed breakdown of economic performance across different cost categories. The profit dashboard helps businesses analyze revenue streams, cost structures, and profitability.
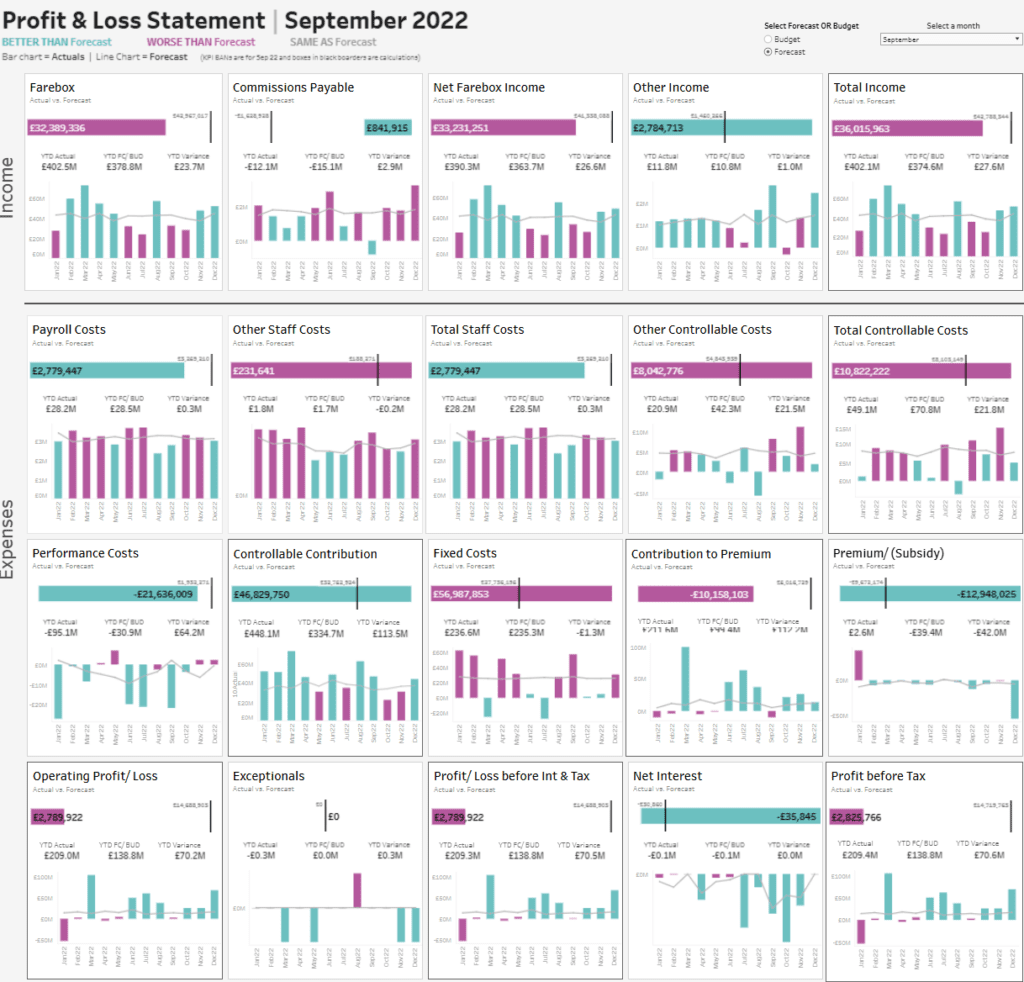
Chart Types Used
- Bar Charts visualize each financial category. Different colours represent actuals and forecasted values, making it easy to identify v’s profit performance. It enables businesses to track profitability trends, compare performance across various states and product categories, and make data-driven decisions to optimize financial outcomes.
Chart Types Used
- Key Metric Indicators: Displays MTD Profit, Pre-Month Profit, and YTD Profit with percentage changes year-over-year (YoY), allowing users to assess performance quickly.
- Line Charts: Shows profit trends over time, helping to identify seasonal patterns, growth, or decline.
- Bar Charts: These are used in the MTD by State and MTD by Category sections to compare profitability across different regions and product categories.
- Horizontal Bar Charts: Highlight profit and loss variations in different states and product sub-categories, showing high and low-performance areas.
Users and Decision-Making
This P&L dashboard is helpful for:
- Executives and Financial Analysts: Helps assess overall profitability and track key performance indicators.
- Sales and Marketing Teams: Identifies high-performing states and product categories to adjust sales strategies accordingly.
- Operations and Supply Chain Managers: Monitors which product categories contribute most to profit and which require cost optimization.
- Retail and E-commerce Businesses: Uses state-level data to focus on high-revenue regions and address underperforming areas.
Benefits to a Company
- Profitability Analysis: The profitability dashboard provides a clear view of revenue contributions by region and category, helping optimize product and market focus.
- Performance Tracking: Allows businesses to monitor changes in profit trends over time, making it easier to respond to fluctuations.
- Strategic Decision-Making: Identifies which states and product segments drive profitability, helping executives refine sales and inventory strategies.
- Cost Control: Highlights areas of financial loss or low-margin categories that may require process improvements or pricing adjustments.
This profit and loss dashboard delivers essential insights, enabling companies to improve financial planning and drive sustainable business growth.
#8 Profit Dashboard – Revenue & Profit KPI Dashboard
This profit dashboard provides a detailed financial overview, focusing on Month-’s profit performance. It enables businesses to track profitability trends, compare performance across different states and product categories, and make data-driven decisions to optimize financial outcomes.
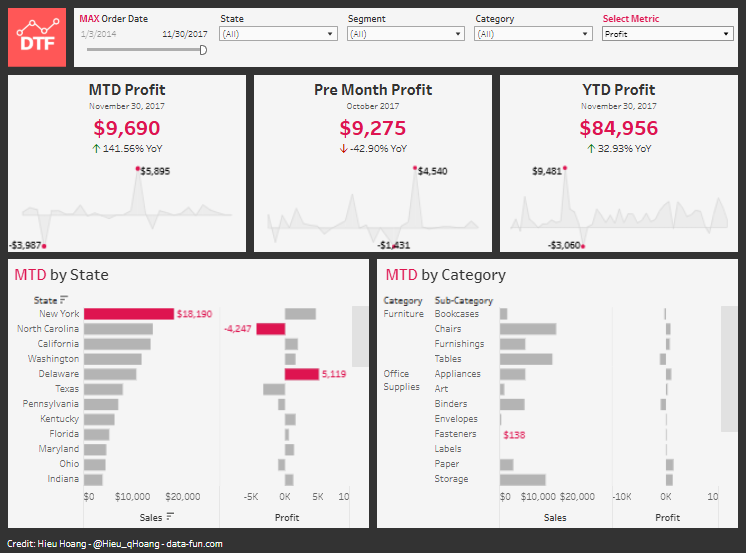
Chart Types Used
- Key Metric Indicators: Displays MTD Profit, Pre-Month Profit, and YTD Profit with percentage changes year-over-year (YoY), allowing users to assess performance quickly.
- Line Charts: Shows profit trends over time, helping to identify seasonal patterns, growth, or decline.
- Bar Charts: These are used in the MTD by State and MTD by Category sections to compare profitability across different regions and product categories.
- Horizontal Bar Charts: Highlight profit and loss variations in different states and product sub-categories, showing high and low-performance areas.
Users and Decision-Making
This p&l dashboard is helpful for:
- Executives and Financial Analysts: Helps assess overall profitability and track key performance indicators.
- Sales and Marketing Teams: Identifies high-performing states and product categories to adjust sales strategies accordingly.
- Operations and Supply Chain Managers: Monitors which product categories contribute most to profit and which require cost optimization.
- Retail and E-commerce Businesses: Uses state-level data to focus on high-revenue regions and address underperforming areas.
Benefits to a Company
- Profitability Analysis: The profitability dashboard provides a clear view of revenue contributions by region and category, helping optimize product and market focus.
- Performance Tracking: Allows businesses to monitor changes in profit trends over time, making it easier to respond to fluctuations.
- Strategic Decision-Making: Identifies which states and product segments drive profitability, helping executives refine sales and inventory strategies.
- Cost Control: Highlights areas of financial loss or low-margin categories that may require process improvements or pricing adjustments.
This profit and loss dashboard delivers essential insights, enabling companies to improve financial planning and drive sustainable business growth.
#9 Profit Dashboard – Makana Health Medical Device Profit Analysis
This profitability dashboard comprehensively analyses sales, profit, and profit ratio across different categories, regions, and products. It helps businesses understand how different product lines perform, which regions contribute most to profitability, and where financial inefficiencies exist.
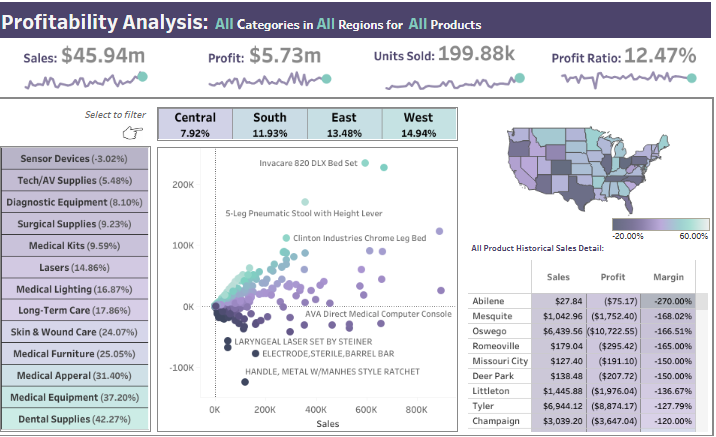
Chart Types Used
- Key Metric Indicators: Displays total sales ($45.94M), profit ($5.73M), total units sold (199.88K), and the overall profit ratio (12.47%), offering a quick financial snapshot.
- Line Charts Show sales, profit, and unit trends over time, helping to track fluctuations and growth patterns.
- Bubble Chart: Represents product performance by plotting sales volume against profit, with bubble size indicating relative contribution.
- Heat Map: The profitability map highlights regional variations, helping identify high-performing and low-margin areas.
- Table with Historical Sales Data: Lists cities, their sales, profit, and margin, making it easy to compare regional financial performance.
Users and Decision-Making
This profit and loss dashboard is valuable for:
- Executives and Financial Managers: Helps assess overall profitability and determine which regions or product categories drive financial success.
- Sales and Marketing Teams: Identifies underperforming categories and regions, allowing for targeted sales strategies.
- Product Managers: Evaluate which product lines generate the highest profit and which need improvement.
- Operations and Supply Chain Teams: Helps manage inventory by identifying high-demand and low-profitability products.
Benefits to a Company
- Regional Performance Analysis: The P&L dashboard provides insights into profitability by location, allowing businesses to optimize regional strategies.
- Product Optimization: Identifies high-margin and low-margin products, enabling better pricing and promotional decisions.
- Strategic Sales Planning: Supports data-driven sales and marketing efforts by pinpointing key revenue drivers.
- Cost Reduction: Helps businesses address underperforming products and improve financial efficiency.
This profit dashboard offers actionable insights, ensuring businesses maximize revenue, enhance profitability, and refine operational strategies for long-term success.
#10 Profit Dashboard – Amazon’s Revenue vs. Profit
This profit dashboard provides a clear visual comparison of Amazon’s revenue and profit over time, highlighting financial performance trends from 2006 to 2019. It offers a high-level overview of total revenue, net profit, and profit ratio, making tracking the company’s financial growth easy.
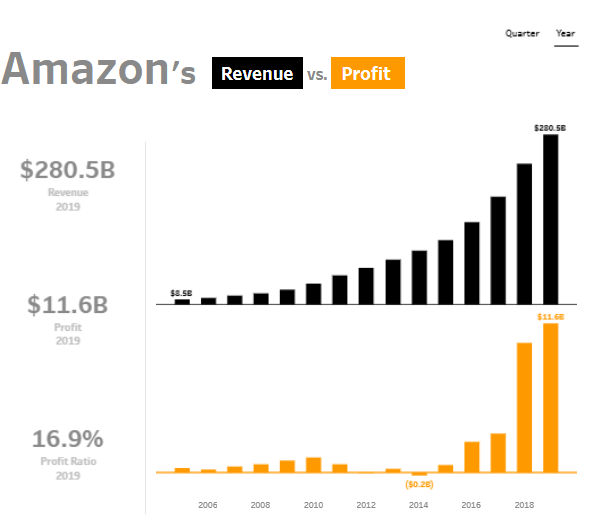
Chart Types Used
- Bar Charts: The profitability dashboard uses two stacked bar charts to separate revenue (black bars) and profit (orange bars). This enables a direct comparison of the company’s financial growth and profitability.
- Key Metric Indicators: Displayed on the left, these highlight Amazon’s 2019 revenue ($280.5B), profit ($11.6B), and profit ratio (16.9%), allowing users to assess financial performance at a glance.
- Trend Analysis: The bar charts illustrate historical trends, showing steady revenue growth alongside a significant increase in profitability in recent years.
Users and Decision-Making
This P&L dashboard is helpful for:
- Investors and Analysts: Help evaluate Amazon’s financial trajectory and profitability trends for investment decisions.
- Executives and Finance Teams: Provides insights into revenue expansion and profit growth, aiding in strategic planning.
- Business Researchers and Economists: Analyze Amazon’s financial evolution and market dominance.
- Stakeholders and Shareholders: Assesses overall company performance and financial stability.
Benefits to a Company
- Financial Performance Tracking: The profit and loss dashboard allows businesses to measure revenue and profit growth over time.
- Strategic Planning: Helps executives make data-driven decisions to maintain or enhance profitability.
- Investment Insights: Highlights Amazon’s increasing profit margins, which is valuable for attracting potential investors.
- Competitive Benchmarking: It provides a model for other companies to assess revenue and profit growth trends.
This profitability dashboard presents a powerful visual representation of financial data, helping businesses and investors understand long-term profitability trends and make informed financial decisions.
#11 Profit Dashboard – Change in Profits and Sales
This profitability dashboard visualizes the year-over-year change in profits and sales for various product categories from 2018 to 2019. It highlights which products experienced growth in metrics and which saw declines, enabling businesses to assess product performance and make informed strategic decisions.
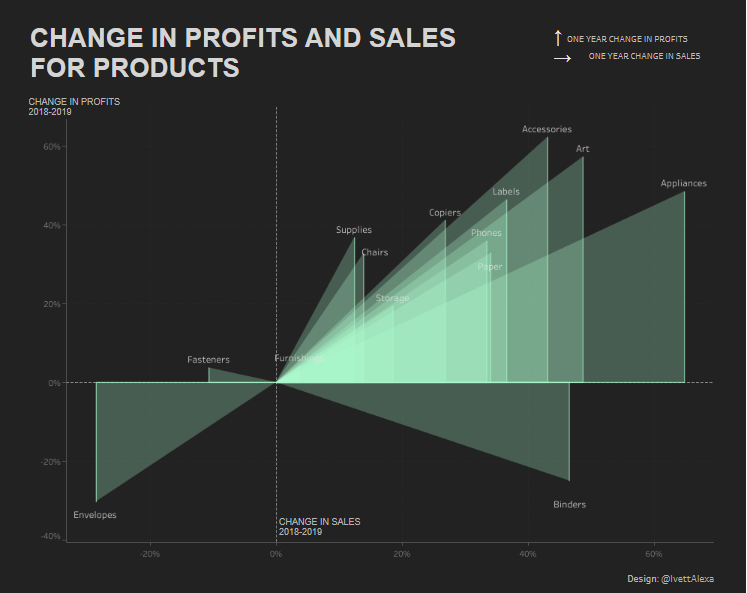
Chart Types Used
- Diverging Bar Chart: The profit dashboard displays changes in both sales and profits on an X-Y axis, where the horizontal axis represents the percentage change in sales and the vertical axis represents the percentage change in profits.
- Arrow Indicators: The direction and length of the arrows indicate the magnitude of change for each product category, making it easy to identify trends.
- Colour-Coded Visualization: The gradient highlights positive and negative movements, allowing for quick assessment of profitability trends.
Users and Decision-Making
This profit and loss dashboard is valuable for:
- Executives and Business Owners: Helps assess which product categories contribute most to revenue growth and profitability.
- Sales and Marketing Teams: Identifies high-performing products for promotional focus and those with declining profitability that may need repositioning.
- Product Managers: Evaluate product lines to determine which should be expanded, optimized, or discontinued.
- Financial Analysts: Provides insight into revenue trends and profit margins to support forecasting and strategic planning.
Benefits to a Company
- Profitability Optimization: The P&L dashboard helps businesses identify which products are driving profit increases and which ones are underperforming.
- Data-Driven Decision Making: Provides clear insights for pricing adjustments, inventory management, and marketing investments.
- Risk Management: Highlights declining sales or negative profit trends, enabling proactive corrective measures.
- Market Strategy Development: Assists businesses in allocating resources effectively by focusing on high-margin, high-growth products.
This profit and loss dashboard delivers a dynamic and visually engaging way to track financial performance, ensuring businesses maximize profitability and maintain sustainable growth.
#12 Profit Dashboard – Sales & Profit Rolling Forecast
This profitability dashboard provides a detailed sales and profit rolling forecast, allowing businesses to adjust prior-year (PY) sales and profit ratios for the rest of the year (RoY). It presents a structured financial outlook by comparing year-to-date (YTD) actuals, adjusted PY values, and current-year (CY) forecasts. The profit dashboard helps businesses analyze projected revenue and profitability trends across different categories and regions.
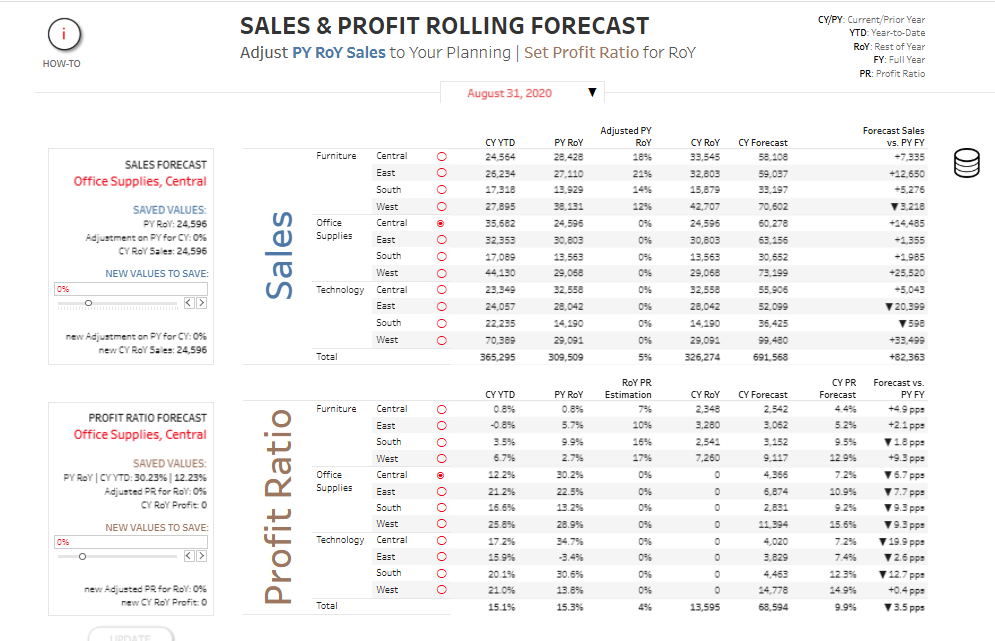
Chart Types Used
- Data Tables: The profit and loss dashboard primarily uses structured tables to present sales and profit ratio forecasts, displaying comparisons between prior-year actuals, adjustments, and current-year forecasts.
- Interactive Sliders: Allows users to adjust PY RoY sales and profit ratios, making real-time forecast updates.
- Variance Indicators: Highlights changes between forecasted sales and prior year full-year (FY) values, helping users quickly identify performance deviations.
- Percentage Comparisons: This displays the estimation of profit ratio (PR), CY Roy profit percentages, and the differences between current and prior-year profit forecasts.
Users and Decision-Making
This p&l dashboard is beneficial for:
- Financial Analysts and Planners: Adjusting previous year data helps create dynamic sales and profitability forecasts.
- Executives and Business Owners: Assists strategic decision-making by visualizing expected financial outcomes.
- Sales and Revenue Teams: Enables sales departments to track projected performance across different regions and categories.
- Operations and Budgeting Teams: Supports planning efforts by providing an overview of expected revenue and profit margins.
Benefits to a Company
- Data-Driven Forecasting: The profitability dashboard provides an interactive way to refine financial projections.
- Performance Benchmarking: Compares prior year sales and profit margins to the current year forecast, allowing businesses to measure growth.
- Strategic Decision-Making: Helps identify areas of strength and weakness, enabling companies to allocate resources effectively.
- Financial Accuracy: Reduces uncertainty in profit projections by allowing real-time adjustments to RoY sales and profit estimates.
This profit-and-loss dashboard is essential for businesses that want to optimize their financial planning, track sales growth, and improve their overall profitability.
#13 Profit Dashboard – Profit Forecast Analysis
This profit forecast dashboard comprehensively analyses projected financial performance, comparing current trends to end-of-year (EOY) targets. It enables businesses to track year-to-date (YTD) profit, forecasted profit, and target profit across multiple countries, allowing for a regional comparison of financial progress.
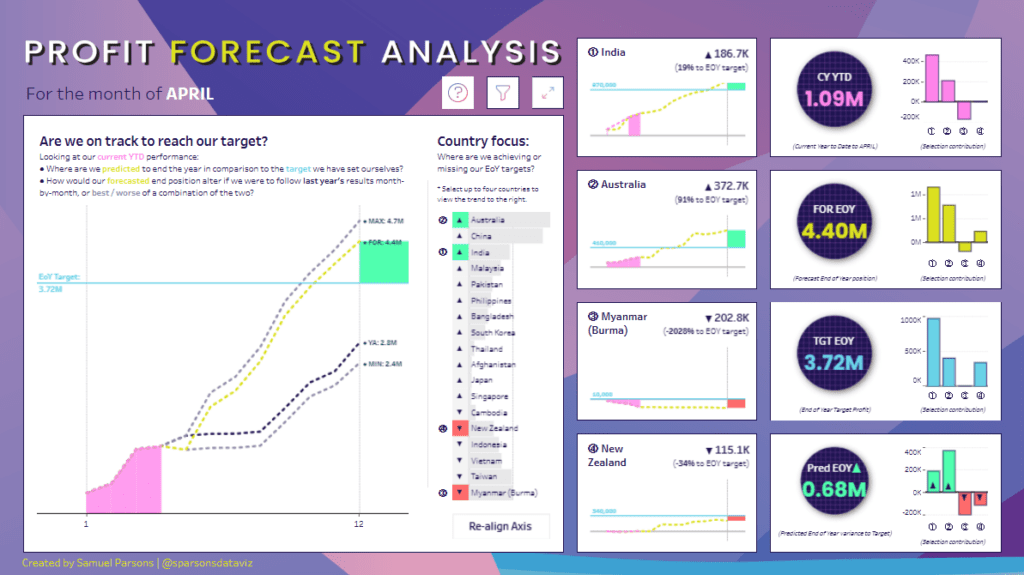
Chart Types Used
- Line Charts: The main chart visualizes historical profit trends and different forecast scenarios (best, worst, and expected outcomes) to assess the probability of meeting EOY targets.
- Bar Charts: These are used in country-specific sections to compare YTD profit, forecasted profit, and EOY targets, making it easy to analyze regional contributions.
- Bubble Charts: Displays financial metrics such as total YTD profit (1.09M), projected EOY position (4.40M), and end-of-year target profit (3.72M), offering a quick snapshot of overall progress.
- Selection Contribution Charts: Helps break down country-level profitability, showing which regions are overperforming or underperforming.
Users and Decision-Making
This profitability dashboard is beneficial for:
- Executives and Financial Analysts: Helps monitor financial targets and identify which countries are on track or falling behind.
- Regional Sales and Operations Teams: Managers can compare country-specific performance and adjust strategies to meet profitability goals.
- Strategic Planning and Forecasting Teams: Supports long-term decision-making by highlighting gaps between projected and actual performance.
- Investors and Stakeholders: Provides transparency into financial expectations and helps assess the company’s fiscal health.
Benefits to a Company
- Performance Tracking: The profit and loss dashboard enables real-time monitoring of revenue trends, ensuring companies stay on target.
- Proactive Strategy Adjustments: Businesses can react to underperforming regions by reallocating resources or adjusting strategies.
- Data-Driven Decision Making: The P&L dashboard offers a structured approach to financial forecasting, improving budgeting accuracy.
- Regional Profitability Insights: Helps companies focus on high-performing markets while addressing areas of concern.
This profit dashboard is essential for businesses looking to enhance financial visibility, optimize profitability, and ensure sustainable growth.
By leveraging a P&L dashboard, companies can track key performance indicators in real time, identify underperforming areas, and adjust strategies accordingly. Investing in the right profit dashboard ensures that financial data is not only accessible but also actionable. Adopting a well-designed dashboard is crucial in improving financial planning and decision-making. Explore these examples and start optimizing profitability today.