The Marketing Analytics in Tableau course is a comprehensive and interactive program designed to help professionals master the art of analyzing marketing performance using Tableau. This marketing analytics course consists of four key chapters, each focusing on crucial aspects of marketing analytics.
Related posts:
- Check Out 13 Amazing Tableau Marketing Dashboard Examples
- Google Analytics with Tableau: 5 Great Examples
- 7 Amazing Customer Dashboard Examples for Actionable Customer Insights
- Best 5 CRM Dashboard Examples to Boost Your Customer Strategy!
- An Amazing Healthcare Analytics Course: Master Healthcare Analytics with Tableau
- 6 Amazing Campaign Dashboard Examples to Track and Optimize Marketing Performance
This post may contain affiliate links. If you click on these links and make a purchase, we may earn a commission at no additional cost to you. Our recommendations are based on genuine experience and research. Thank you for supporting our work!

Table of Contents
Course Summary

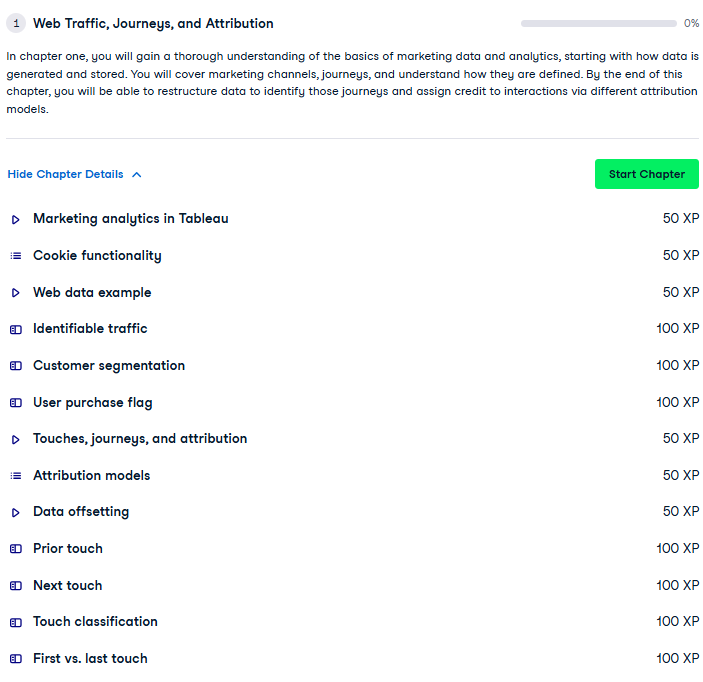
Chapter 1: Web Traffic, Journeys, and Attribution
- Introduces the fundamentals of marketing analytics in Tableau.
- Explains how data is generated through cookies and classified into first, second, and third-party data.
- Covers customer segmentation and tracking user purchase flags.
- Discuss touches, attribution models, and concepts like prior touch, next touch, and first vs. last touch to attribute campaign success effectively.
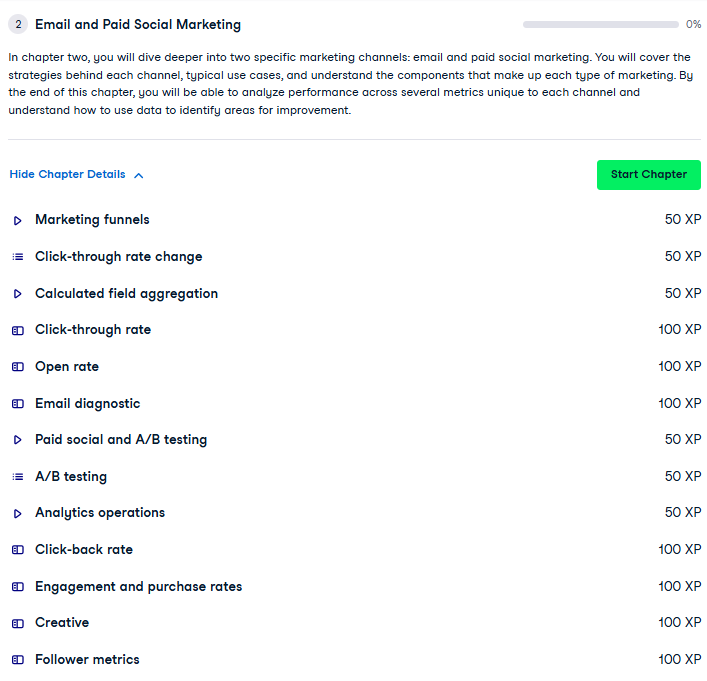
Chapter 2: Email and Paid Social Marketing
- It analyses specific marketing channels, such as email and paid social media.
- Includes metrics like click-through rates, open rates, and engagement rates.
- Discusses A/B testing and analytics for improving campaign performance.
- Covers strategies for analyzing creative and follower metrics for social campaigns.
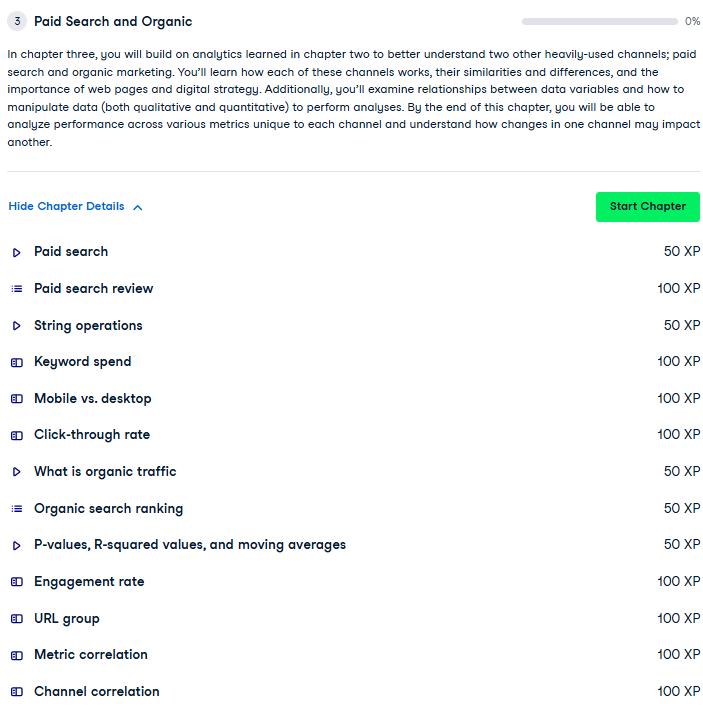
Chapter 3: Paid Search and Organic Marketing
- Explores paid search and organic marketing channels, their similarities, and differences.
- Examines keyword spend, mobile vs. desktop traffic, and click-through rates.
- Introduces organic traffic analysis and search engine ranking metrics.
- Provides tools like P-values and moving averages for advanced analysis.
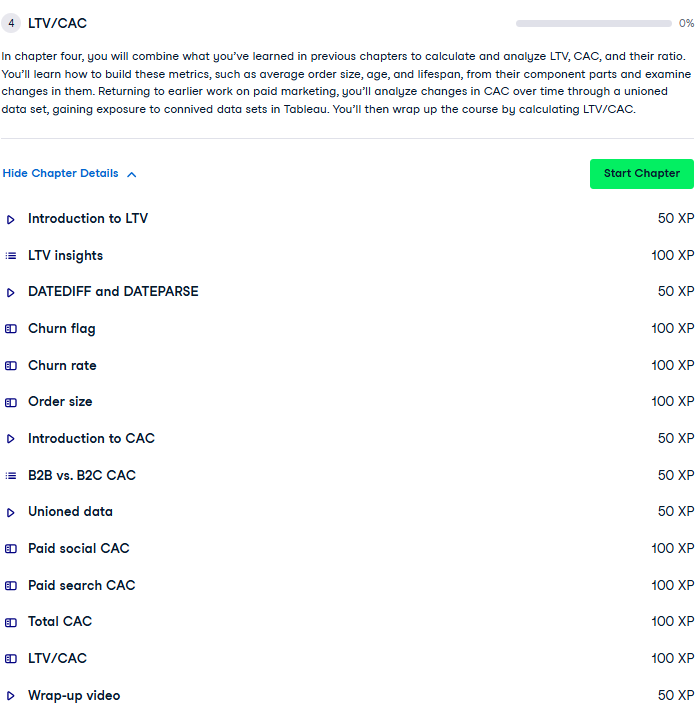
Chapter 4: Lifetime Value (LTV) and Customer Acquisition Cost (CAC)
- Combines knowledge from previous chapters to calculate and analyze LTV, CAC, and their ratio.
- Teaches the use of Tableau functions like DATEDIFF and DATEPARSE for detailed calculations.
- Analyzes churn rates, order sizes, and CAC across B2B and B2C contexts.
- It wraps up with a deep dive into how to benchmark performance using LTV/CAC.
The course spans 6 hours and includes 17 videos and 53 exercises, making it a practical and immersive experience. It is suitable for advanced users looking to enhance their skills in marketing analytics, with over 1,800 participants earning 4,150 XP upon completion.
A marketing analytics course covers the fundamentals of collecting, measuring, and analyzing data to evaluate the effectiveness of marketing strategies. By identifying trends, calculating metrics, and assessing performance, businesses can fine-tune their approaches for maximum ROI.
At its core, marketing analytics serves two primary objectives:
– Customer Acquisition: Attracting new customers through targeted campaigns.
– Customer Retention: Keeping existing customers engaged and loyal to the brand.
These goals are achieved by leveraging data across various marketing channels, such as social media, email, affiliate marketing, paid search, and display advertising.
The marketing analytics course also emphasizes continuous improvement. Companies often use metrics like engagement rates, customer lifetime value (LTV), and cost per acquisition (CPA) to gauge success. Tools like Tableau are pivotal in visualizing this data, providing insights into what works and what doesn’t.
Tableau is one of the most user-friendly and powerful tools for visualizing and analyzing marketing data. Its intuitive interface allows marketers to create dashboards that display key metrics and trends in an easily digestible format.
Examples of Types of Analysis in This Course
#1 Example of Marketing Analytics – Purchase Journeys
This analysis compares customer journeys categorized as “No Purchase Journeys” and “Purchase Journeys” based on distinct session counts across marketing channels. The “No Purchase Journeys” chart highlights Organic as the leading channel with the highest session count, followed by Paid Social and Paid Search, indicating significant traffic without conversions. In contrast, the “Purchase Journeys” chart is segmented into First Touch and Final Touch.

Email dominates both touchpoints, showing its effectiveness in driving conversions, while Organic also contributes notably. Paid Social and Paid Search show lower session counts in purchase journeys, suggesting potential areas for optimization to improve their conversion effectiveness.
#2 Example of Marketing Analytics – Sent Email Rate vs Click Through Rate Analysis
This scatter plot analysis evaluates email marketing performance by plotting click-through rates (CTR) on the y-axis against another critical metric, likely email open rates or send volume, on the x-axis. Each circle represents a landing page or subject line, with size denoting the number of emails sent.
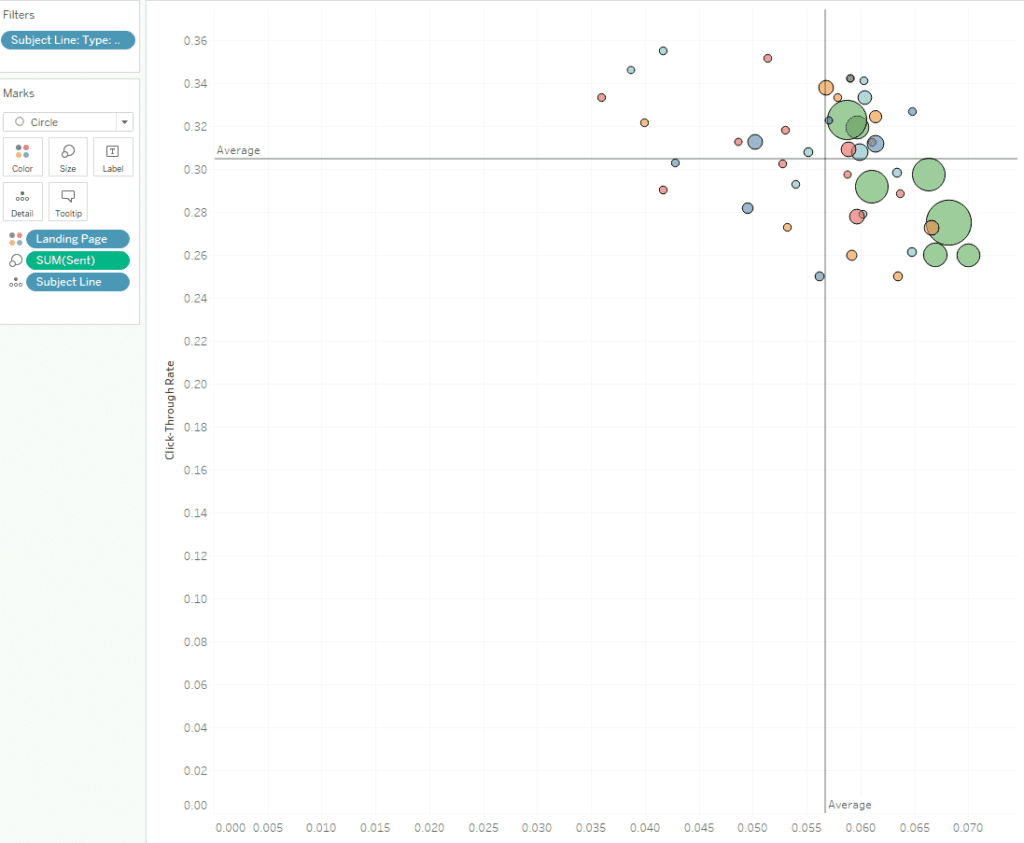
The chart is divided into quadrants by average CTR and the other metric, highlighting high-performing and underperforming email campaigns. Larger circles in the top-right quadrant indicate campaigns with above-average CTR and send volume, making them highly successful. Conversely, campaigns in the bottom-left quadrant underperform, suggesting areas for optimization in subject lines or landing pages.
#3 Example of Marketing Analytics – Channel Correlation
This line chart visualizes the correlation between Organic and Paid Search channels based on the average of normalized visits in 2022. Organic traffic, represented by the blue line, shows consistently higher engagement with a gradual upward trend throughout the year, outperforming Paid Search. Paid Search, represented by the orange line, follows a steadier growth trajectory but remains below Organic in overall performance.
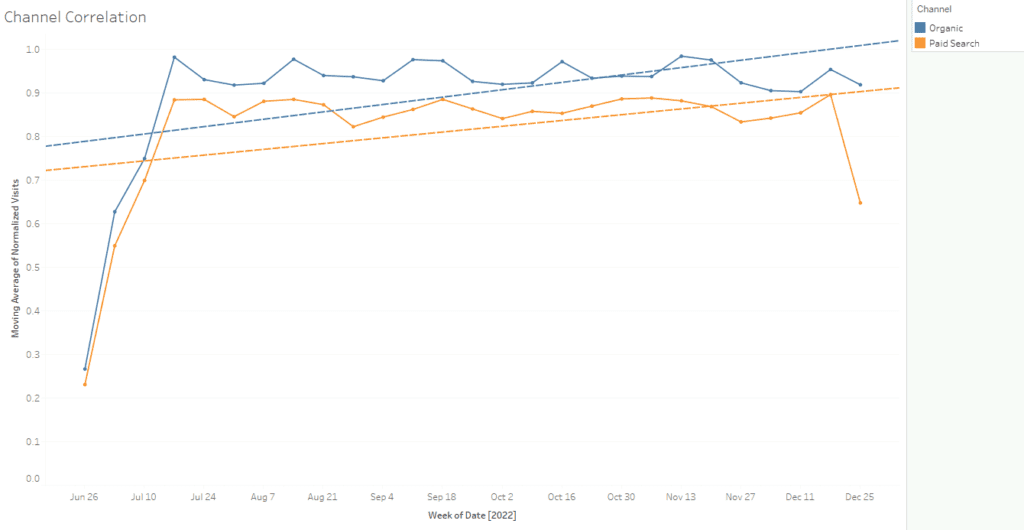
The dashed trendlines indicate a more robust long-term growth rate for Organic than Paid Search. A significant drop in Paid Search visits is observed toward the end of the year, highlighting potential issues that may require optimization. This analysis helps identify the relative performance and potential improvement areas for these two key marketing channels.
#4 Example of Marketing Analytics – Customer Acquisition Costs
This bar chart visualizes the Customer Acquisition Cost (CAC) trends across Paid Search, Paid Social, and combined channels over six months in 2022. Each bar represents the CAC for a specific channel (red for total CAC, green for Paid Search CAC, and orange for Paid Social CAC), showing monthly variations.
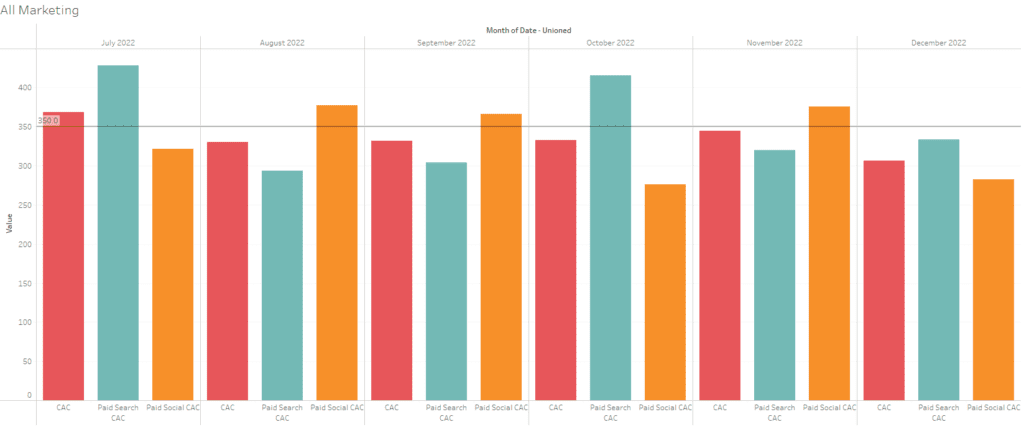
In July 2022, Paid Social exhibits the highest CAC, but by October, Paid Search surpasses it, indicating shifts in channel efficiency. The total CAC fluctuates but remains relatively stable compared to individual channels. Monitoring these trends enables businesses to identify cost spikes and optimize resource allocation across channels. The horizontal line highlights the CAC benchmark for comparison, helping to evaluate which months exceed or fall below the desired threshold.
Benefits of Tableau for Marketers:
– Visual Clarity: Tableau’s interactive dashboards provide clear, customizable visualizations, making it easier to communicate insights to stakeholders.
– Data Integration: Connect multiple data sources, from Google Analytics and social media platforms to CRM systems, to ensure a comprehensive view of marketing performance.
– Advanced Analysis: Features like calculated fields and LOD (Level of Detail) expressions allow in-depth data exploration.
– Real-Time Reporting: Monitor campaign performance in real-time, enabling quick decision-making and optimization.
With Tableau and a marketing analytics course, marketers can bridge the gap between raw data and actionable insights, turning numbers into strategies that drive growth.
One of the most critical aspects of marketing analytics is customer churn analysis. Churn refers to the rate customers stop doing business with a company. A churn dashboard is a tool used to monitor this metric, providing insights into why customers leave and how to retain them.
This marketing analytics course is invaluable to marketers as it equips them with the essential skills and tools to optimize campaigns, analyze performance, and make data-driven decisions. By focusing on Tableau, a powerful data visualization tool, the course enables marketers to turn complex data into actionable insights, ensuring they can effectively track and improve key metrics across various channels.
The marketing analytics course delves into critical aspects of marketing, such as customer acquisition and retention, by teaching participants how to interpret data from channels like email, social media, paid search, and organic marketing. It emphasizes using Tableau’s advanced functions—such as FIXED, DATEPARSE, and CONTAINS—which allow marketers to build dynamic dashboards and perform in-depth analyses.

Participants will also gain expertise in understanding and visualizing customer journeys, attribution models, and Customer Acquisition Cost (CAC) trends. The course introduces critical benchmarking metrics like Lifetime Value (LTV) and engagement rates, enabling marketers to identify high-performing strategies and areas requiring improvement.
With hands-on exercises and real-world examples, this course empowers marketers to craft impactful campaigns, reduce churn, and enhance ROI.


