Are you ready to take your Tableau skills to the next level? Dive into the world of healthcare analytics courses with an engaging case study that allows you to apply your knowledge to a real-world problem. Whether you want to enhance your expertise in healthcare data analytic or explore healthcare data, this healthcare analytics course is designed for you!
Related posts:
- 10 Amazing Tableau Healthcare Dashboard Examples
- Unlock Insights with These 7 Powerful Tableau COVID Dashboards
- Top 5 Hospital Dashboards For Amazing Patient Care
- Unlock Your Potential with An Amazing Marketing Analytics Course
- 9 Life Saving Patient Dashboard Examples
- 5 Stunning Fitness Dashboard Examples That Will Transform How You Track Your Workouts
Affiliate Disclaimer: This post contains affiliate links. If you click through and make a purchase, we may earn a commission at no extra cost to you. Our recommendations are based on our honest opinions and expertise. Thank you for supporting us!
Table of Contents
What You’ll Learn in This Course

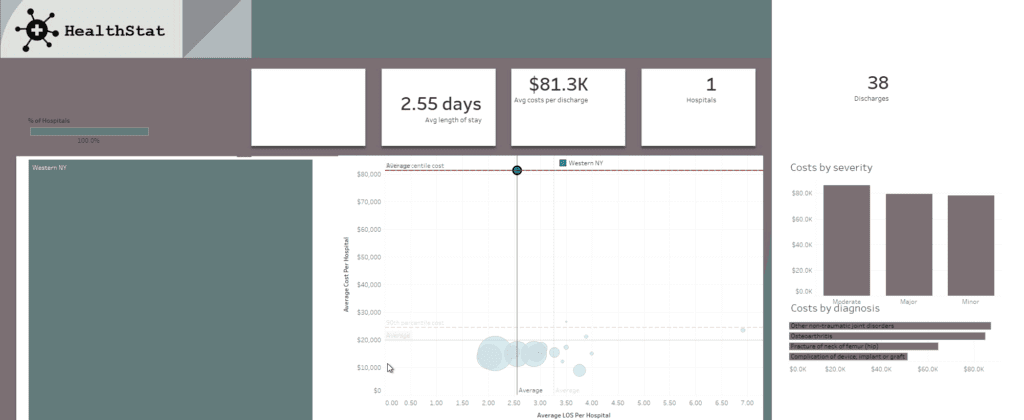
This case study, part of a comprehensive health data analytics course, is led by Maarten, your expert instructor. He will guide you through analyzing hospital efficiency using Tableau. You’ll apply your skills to uncover insights and create a dashboard for a fictitious consulting company, HealthStat. By the end of this course, you’ll have mastered:
- Evaluating state-wide hospital data for efficiency.
- Identifying opportunities for improvement in healthcare operations.
- Designing engaging Tableau dashboards to communicate key insights.

Key Features of the Case Study
Real-World Relevance: You’ll work with anonymous 2016 New York hospital discharge data, focusing on hip replacement surgery. This procedure is a joint elective surgery, providing an excellent lens for analyzing hospital efficiency, as emphasized in health analytics courses.
Step-by-Step Guidance: Learn to measure key metrics like length of stay (LOS) and associated costs while understanding factors such as patient age, procedure type, and hospital size—critical elements of any healthcare data analyst course.

Comprehensive Dataset: The dataset includes 30 columns representing crucial attributes for your analysis. You’ll also access a metadata sheet essential for mastering health data analyst courses.

Course Highlights
Framework for Healthcare Quality: Understand the six domains of healthcare quality, focusing on efficiency—avoiding waste in equipment, supplies, and energy.
Terminology Overview: Familiarize yourself with terms like inpatient, discharge, disposition, and elective surgery—they are essential for success in any health data analytics course.
Patient Population Analysis: Delve into elective hip replacement surgery, exploring hospital stay duration and associated costs, a critical focus in healthcare data analytics courses.
Critical Attributes of Interest: Analyze patient age groups, severity of illness, and risk of mortality to uncover actionable insights, as outlined in leading healthcare analytics courses.

Sample Visualizations and Analysis
Healthcare Analytics Sample 1
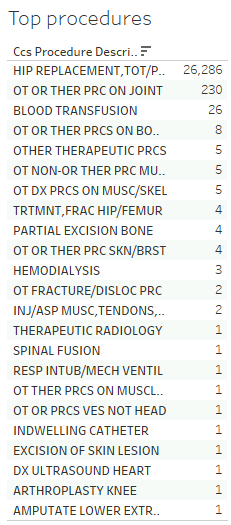
This visualization displays the top procedures from a healthcare dataset ranked by frequency. It highlights Hip Replacement, Total/Partial, as the most common procedure, with 26,286 instances, followed by significantly fewer occurrences of other methods like OT or Other Procedures on Joints (230) and Blood Transfusion (26). Professionals in healthcare analytics courses, healthcare data analytics courses can use this visualization to identify procedural trends, focus on high-volume services, and analyze resource allocation and efficiency. This data is invaluable for those taking a healthcare data analyst course, offering insights to improve hospital operations, optimize costs for frequent procedures, and enhance patient care strategies for commonly performed treatments.

Healthcare Analytics Sample 2
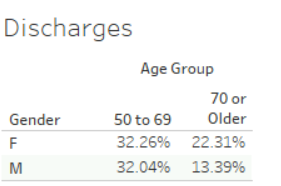
This visualization highlights the distribution of hospital discharges by gender and age group. For individuals aged 50 to 69, females (32.26%) and males (32.04%) have nearly equal discharge rates. However, for those 70 or older, females account for a higher percentage (22.31%) than males (13.39%). Healthcare data analytics professionals can leverage this data to analyze demographic trends in hospital discharges, evaluate care needs for aging populations, and identify gender-based differences in healthcare utilization. Insights from such visualizations are critical for health analytics courses and healthcare data analyst courses to enhance patient care and optimize healthcare resources.

Healthcare Analytics Sample 3
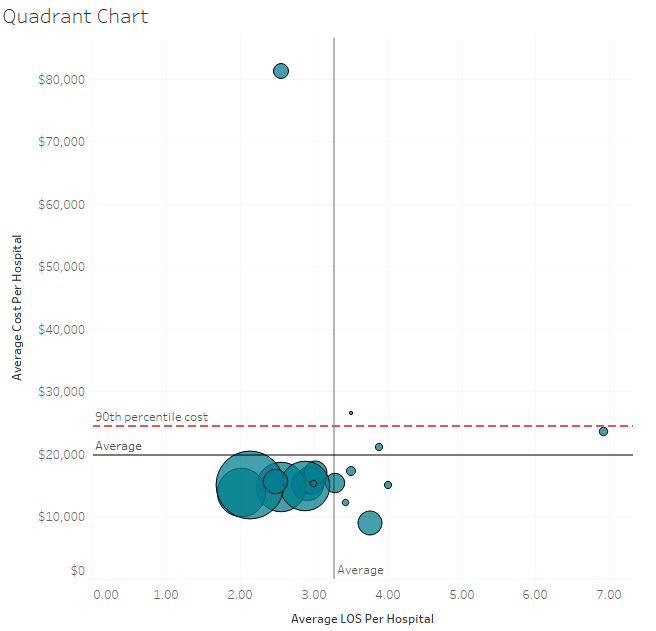
This quadrant chart visualizes hospitals based on their average cost per hospital and average length of stay (LOS). Each bubble represents a hospital, with size indicating patient volume. Key reference lines, including the 90th percentile cost and averages for LOS and cost, provide context for comparison. Professionals taking a healthcare analytics course, healthcare data analytics courses, or health analytics courses can use this chart to identify hospitals with high costs and extended stays, highlighting potential inefficiencies. This visualization is essential for those in a healthcare data analyst or health data analytics course of analyzing operational performance, optimising resources, and enhancing decision-making strategies.

Your Final Deliverable
By the end of this healthcare data analyst course, you’ll create a professional-grade dashboard that allows stakeholders to:
- Progress logically through key insights.
- View informative, concise visuals.
- Access actionable data to improve hospital efficiency.

Why You Should Enroll
This course is perfect for:
- Data professionals are eager to apply Tableau skills in a health data analytics course.
- Healthcare administrators are looking to improve operational efficiency.
- Anyone interested in the intersection of data analytics and healthcare.
You’ll gain hands-on experience with a real-world dataset and develop a portfolio-worthy dashboard showcasing your health analytics course expertise.
Ready to Start Analyzing?
Don’t miss this opportunity to enhance your skills and stand out in healthcare data analytics courses. Enrol now to take the first step toward mastering healthcare analysis with Tableau. Your journey to uncovering insights and driving efficiency begins today!


