Menu


Here is your solution to build an easy Tableau Donut chart in ten minutes! Chances are you’ve seen a Pie chart somewhere. In this post,

Tableau Candlestick charts are unlike other visualizations because their use is limitedto trading. That being said, Tableau Candlestick charts are a powerful tool fortraders because

Visual storytelling is pivotal in data analysis, enabling professionals to convey complex data sets coherently and attractively. Various charts offer different perspectives, each with their


Bar Chart Tableau. Here’s a fast and easy way to get there in 5 minutes.

Easy 10 minute Tableau Waffle Chart

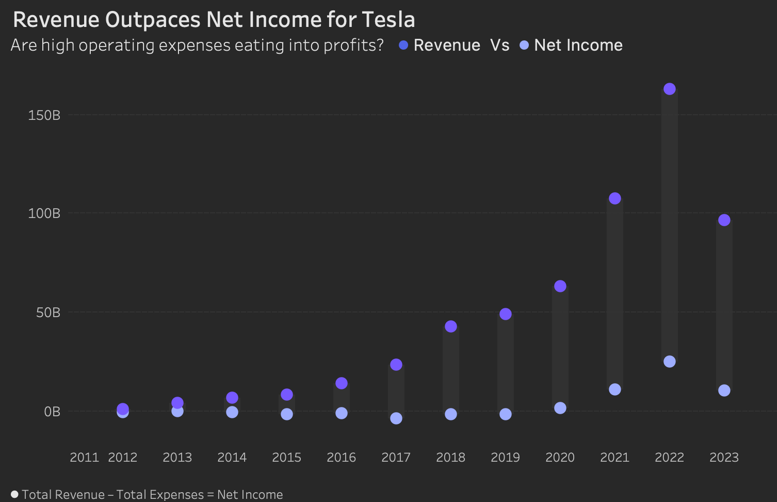
So, how do you make a great Tableau Dumbbell chart to visualize performance gaps? Are you visualizing the difference between two metrics or two groups?

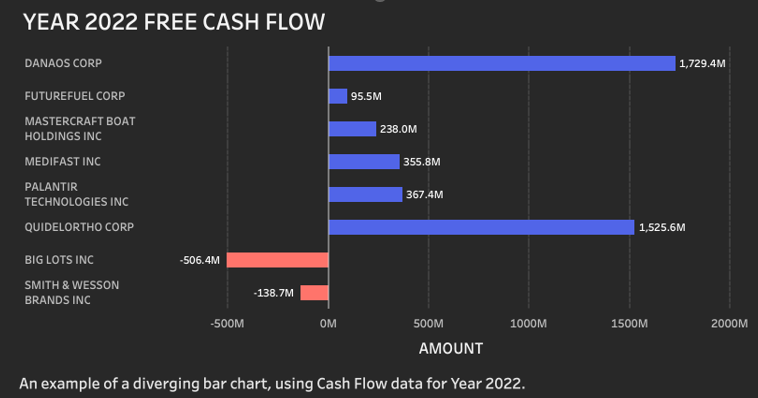
How to Create a Diverging Bar Chart in Tableau Bar charts are a staple in data visualization due to their immense flexibility and ease of
Welcome to our Tableau Consulting Services. We specialize in helping businesses optimize their data analysis and decision-making capabilities using Tableau.
Expert Tableau Consulting Services and Solutions
Quantize Analytics Ltd. 11097872