A well-structured cash flow dashboard is essential for businesses to monitor liquidity, track financial performance, and enhance decision-making. Whether managing daily transactions or analyzing long-term trends, an adequate cash dashboard provides a real-time view of inflows and outflows.
Professionals, from CFOs to financial analysts, rely on dashboard cash flow tools to maintain economic stability and support strategic planning. This blog explores six cash flow dashboard examples, showcasing different approaches to cash management, including Tableau cash flow dashboard solutions. These insights will help businesses utilize financial visualization tools to improve forecasting, budgeting, and overall cash efficiency.
Table of Contents
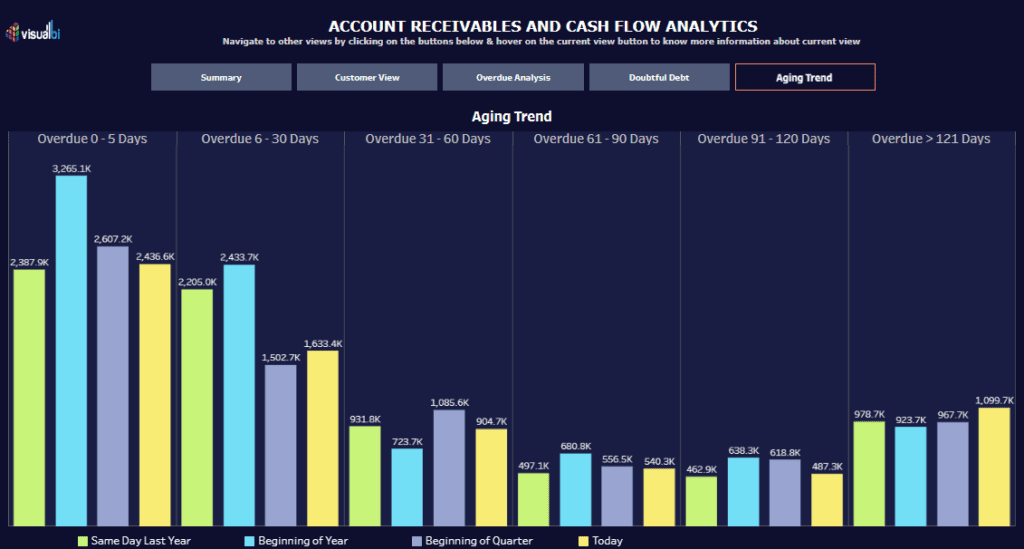
#1 Account Receivables and Cash Flow Analytics
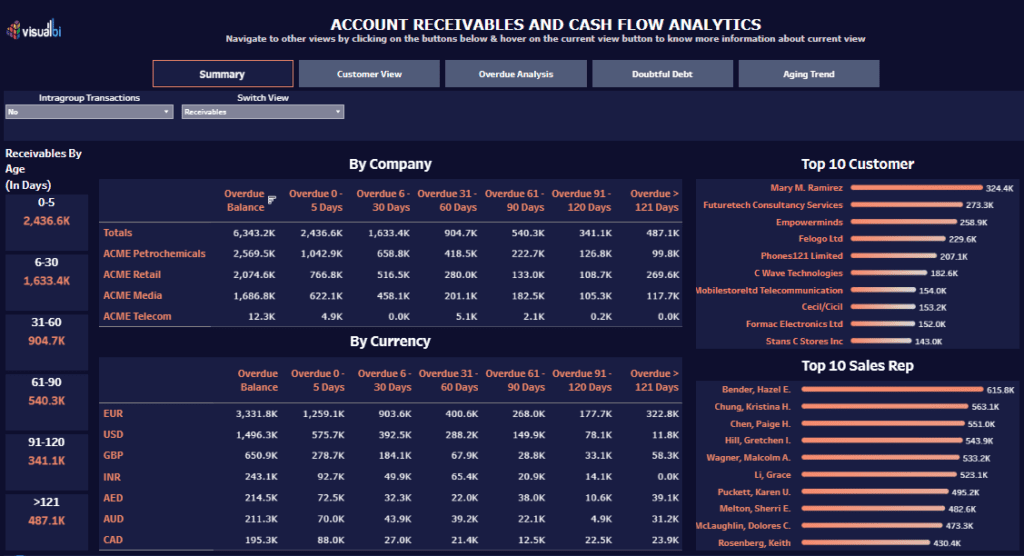
These cash management dashboards provide a comprehensive overview of an organization’s accounts receivable and cash flow analytics. They help finance teams track overdue balances, customer payment behaviors, doubtful debts, and aging trends, improving financial planning and optimizing a cash flow dashboard.
Key Charts in the Dashboards
- Bar Charts – Used in the Aging Trend dashboard to display overdue amounts across different periods, helping users analyze payment delays and historical trends in a cash dashboard.
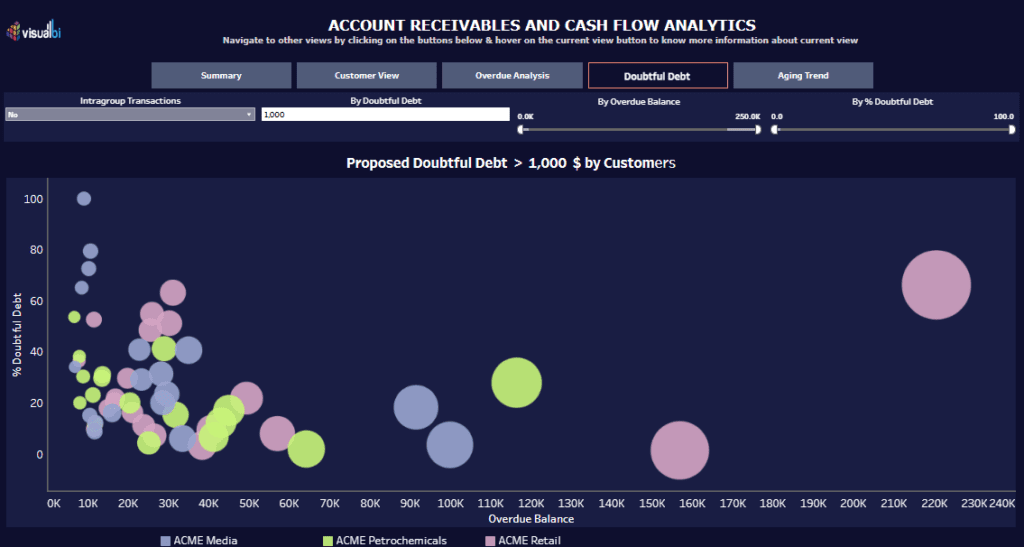
- Bubble Charts – Found in the Doubtful Debt dashboard, visualizing overdue balances vs. percentage risk of doubtful debt for various customers, making it a crucial dashboard cash flow component.
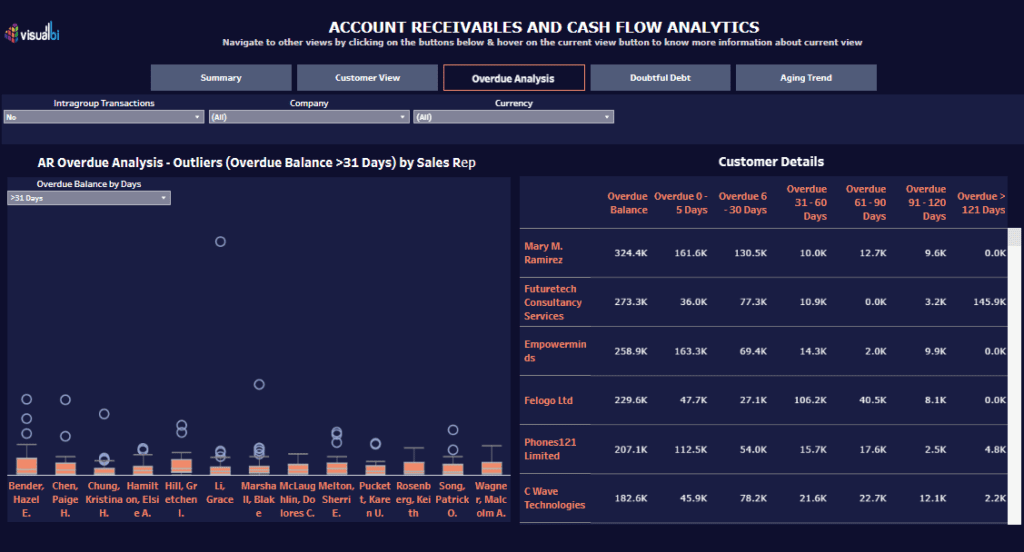
- Scatter Plots – Used in the Overdue Analysis dashboard to highlight outliers, such as customers or sales reps with significantly high overdue balances, enhancing a Tableau cash flow dashboard.
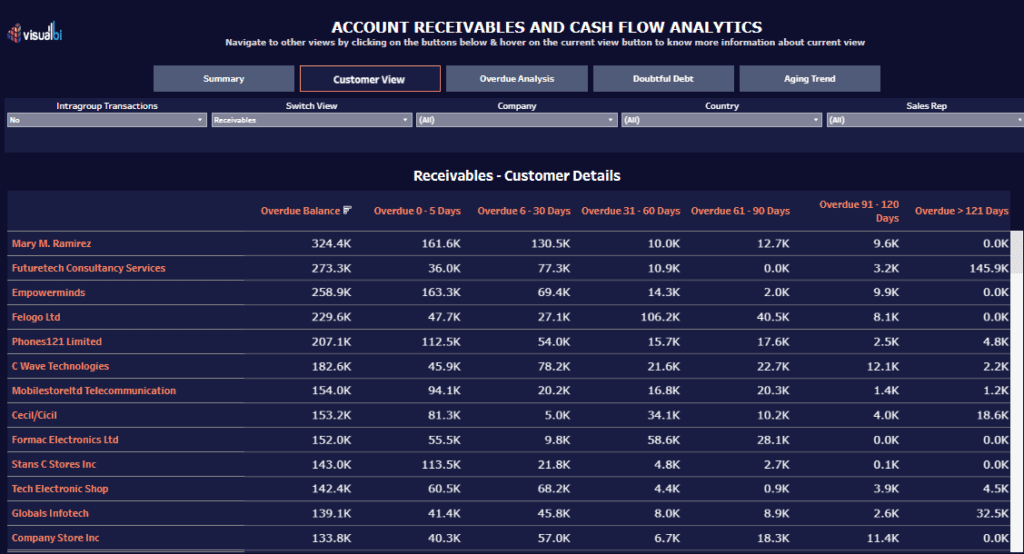
- Table Views – Display detailed breakdowns of overdue balances by company, currency, customer, and sales representative, offering strong cash flow dashboard examples.
- Bar Progress Indicators – Seen in Top 10 Customers & Sales Reps, ranking key contributors to receivables, making it an essential cash management dashboard tool.
Who Would Find These Dashboards Useful?
- CFOs & Finance Directors – This is for high-level cash flow dashboard and receivables oversight.
- Accounts Receivable Teams – To track and follow up on overdue invoices with insights from a cash dashboard.
- Sales Managers – To understand customer payment patterns and their impact on revenue through a dashboard cash flow tool.
- Treasury Teams – To manage liquidity and minimize financial risk using a Tableau cash flow dashboard.
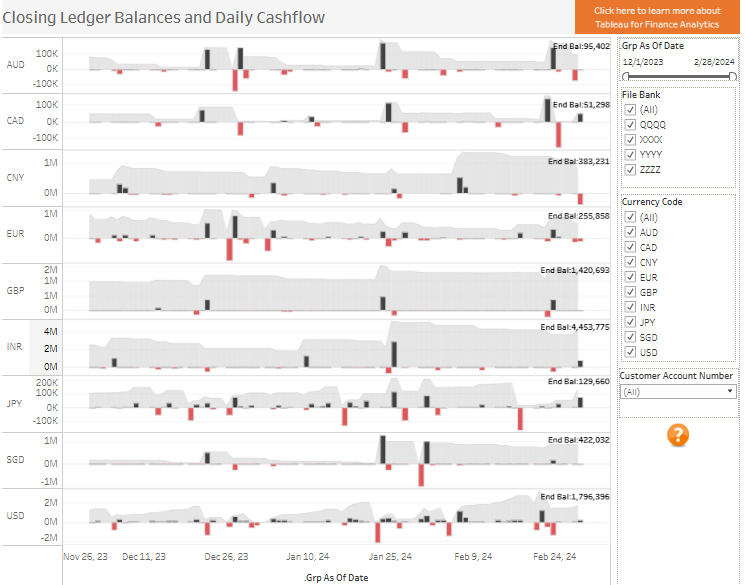
#2 Bank Statement Balances and Daily Cash Flow
This cash management dashboard visualizes closing ledger balances and daily cash flow, providing insight into financial trends across multiple currencies. It tracks fluctuations in cash flow over time, helping organizations monitor liquidity and optimize financial planning.
Key Charts in the Dashboard
- Line Charts – Display cash flow trends across different currencies, showing fluctuations over time. The shaded background provides a historical range, highlighting deviations, making it a valuable cash flow dashboard component.
- Bar Charts – Represent daily cash inflows (black bars) and outflows (red bars), simplifying the identification of spikes or dips in dashboard cash flow.
- Filters & Controls – Enable users to select specific banks, currencies, or customer accounts, enhancing the flexibility of a Tableau cash flow dashboard for precise financial analysis.
Who Would Find This Dashboard Useful?
- CFOs & Finance Directors – Gain a real-time overview of cash balances and liquidity across multiple currencies using a cash flow dashboard.
- Treasury Teams – Manage dashboard cash flow performance by monitoring daily financial movements.
- Accounts Payable & Receivable Teams – Track inflows and outflows to ensure timely payments and collections through a cash dashboard.
- Financial Analysts – Examine cash flow dashboard examples for forecasting and economic strategy development.
This Tableau cash flow dashboard empowers businesses to optimize liquidity and minimize financial risks.
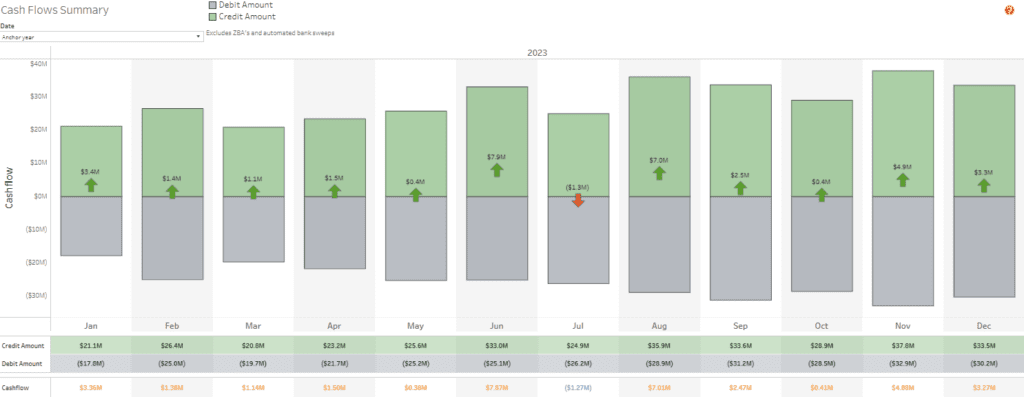
#3 Cash Flow Dashboard
This cash management dashboard provides a detailed cash flow summary, tracking monthly debit and credit amounts. It enables organizations to monitor dashboard cash flow trends, ensuring financial stability and liquidity management.
Key Charts in the Dashboard
- Stacked Bar Charts – Visualize monthly debit (gray) and credit (green) amounts, helping users quickly assess cash dashboard inflows and outflows.
- Arrow Indicators—Arrow indicators highlight net cash flow changes, with green arrows for positive movement and red arrows for declines. This makes financial trends easier to interpret in a cash flow dashboard.
- Tabular View – Breaks down each month’s credit, debit, and net cash flow, providing deeper insights into a Tableau cash flow dashboard.
Who Would Find This Dashboard Useful?
- CFOs & Finance Directors – Gain a high-level overview of company cash movements with a cash flow dashboard.
- Treasury Teams – Use dashboard cash flow insights to manage liquidity and maintain operational funds.
- Finance Managers & Analysts – Evaluate trends through a Tableau cash flow dashboard to refine budgeting and forecasting.
- Accounts Payable & Receivable Teams – Monitor cash dashboard metrics to ensure balanced transactions.
By applying cash flow dashboard examples, businesses can enhance financial decision-making and improve long-term liquidity planning.
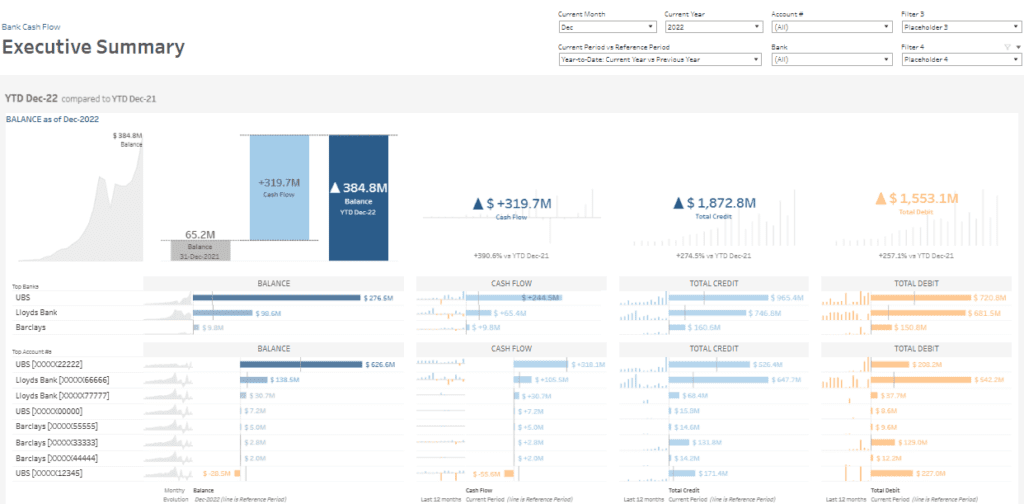
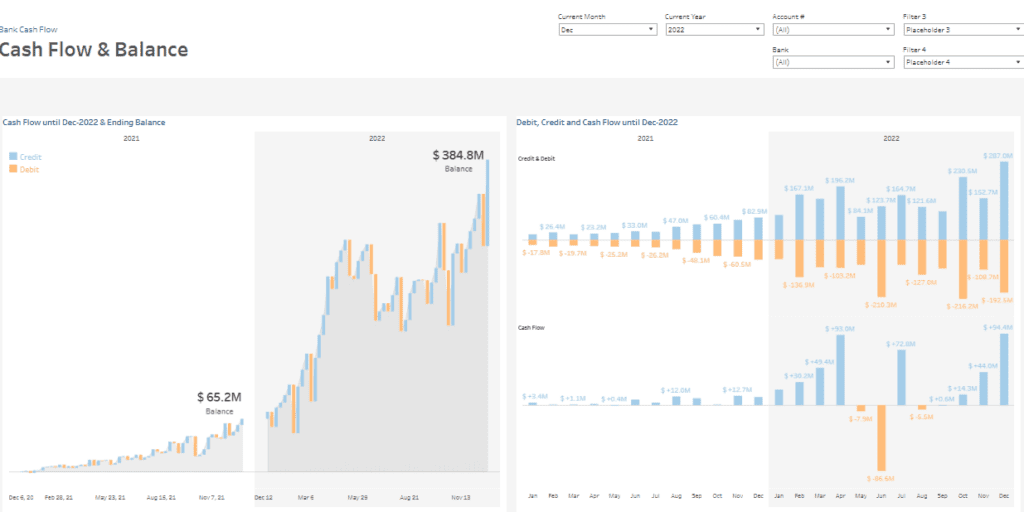
#4 Corporate Finance – Bank Cash Flow
This cash management dashboard provides a comprehensive bank cash flow overview, tracking year-to-date balances, credit, and debit trends. It enables organizations to monitor financial health by comparing dashboard cash flow data across different periods.
Key Charts in the Dashboard
- Bar Charts Visualize total credit and debit amounts, allowing quick comparison of inflows and outflows. Thus, they are valuable cash flow dashboard tools for financial oversight.
- Line Charts – Show cumulative balance growth over time, helping users track liquidity trends in the Tableau cash flow dashboard.
- Stacked Bar Charts – Display monthly credit (blue) and debit (orange) figures, allowing users to analyze detailed cash dashboard fluctuations.
- KPI Metrics & Trend Indicators: Highlight key performance figures, such as the movement of the total cash flow dashboard, year-over-year changes, and bank account balances.
Who Would Find This Dashboard Useful?
- CFOs & Finance Directors – Gain real-time insights into company liquidity using a cash flow dashboard.
- Treasury Teams – Use the cash management dashboard to track and forecast financial movements.
- Finance Analysts – Leverage cash flow dashboard examples for deeper budgeting and forecasting.
- Banking & Accounting Teams – Ensure seamless transaction tracking using the Tableau cash flow dashboard.
This dashboard cash flow visualization strengthens financial decision-making and liquidity management.
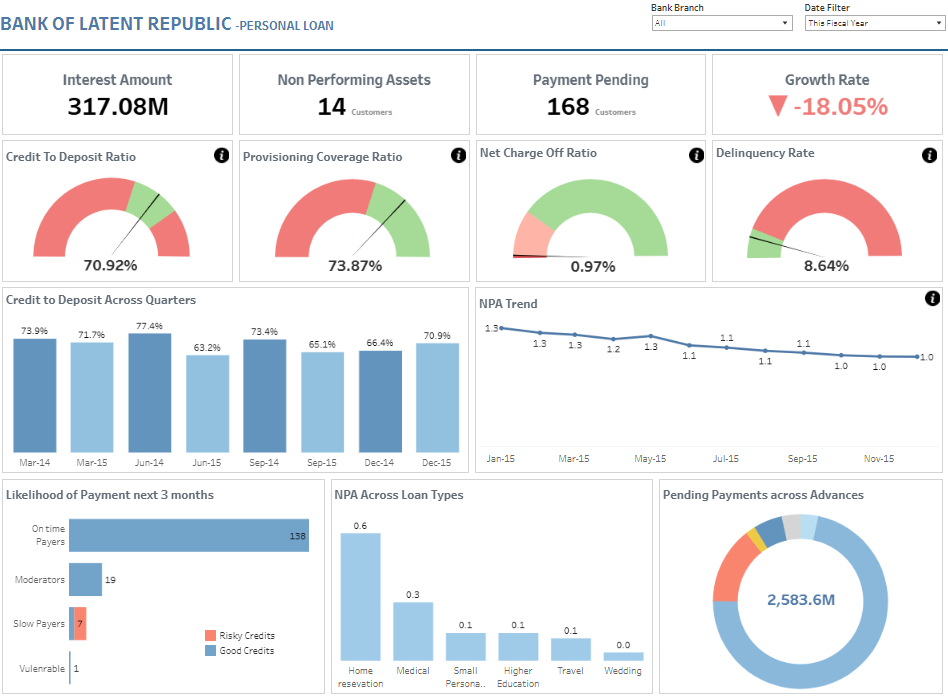
#5 Banking Cash Flows
This cash management dashboard provides a detailed analysis of cash flow, transactions, and loan performance, offering a holistic view of an organization’s financial health. It enables an intuitive cash dashboard to track inflows and outflows, term deposits, loan risks, and customer payments.
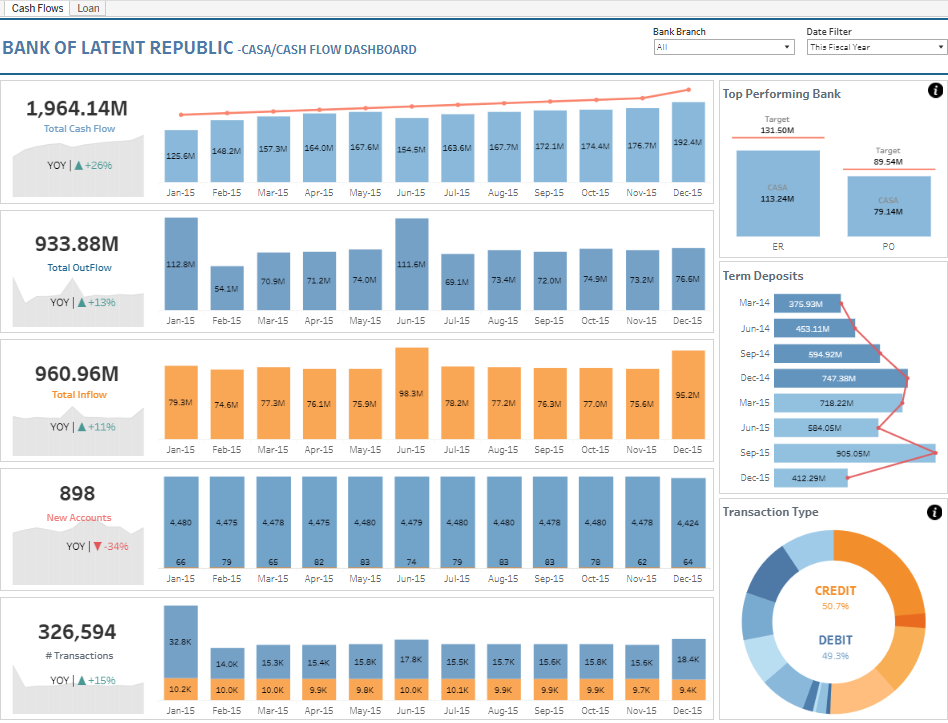
Key Charts in the Dashboard
- Bar Charts – Display cash flow dashboard trends, showing monthly inflows and outflows to assess liquidity and transaction volumes.
- Line Charts Track trends in non-performing assets (NPAs), growth rates, and dashboard cash flow variations over time, aiding financial forecasting.
- Pie Charts – Break down cash dashboard transactions into credit and debit categories, providing a clearer understanding of fund distribution.
- Gauge Charts – Represent key financial ratios like credit-to-deposit and delinquency rates, offering insights into the Tableau cash flow dashboard risk assessment.
- Stacked Bar Charts – Compare term deposits across different periods, helping organizations analyze deposit trends and customer behavior.
Who Would Find This Dashboard Useful?
- Banking & Financial Teams – Monitor deposits, withdrawals, and lending activity using cash flow dashboard examples.
- Risk & Compliance Officers – Evaluate delinquency rates and loan performance with a cash management dashboard.
- CFOs & Treasury Teams – Optimize liquidity management through a Tableau cash flow dashboard.
This dashboard cash flow visualization enhances financial decision-making for businesses and financial institutions.
#6 Cash Flow Dashboard
This cash management dashboard provides a detailed cash flow overview, tracking income, expenses, and balance trends throughout the year. It enables organizations to monitor financial performance, analyze revenue sources, and control expenditure effectively using a cash flow dashboard.
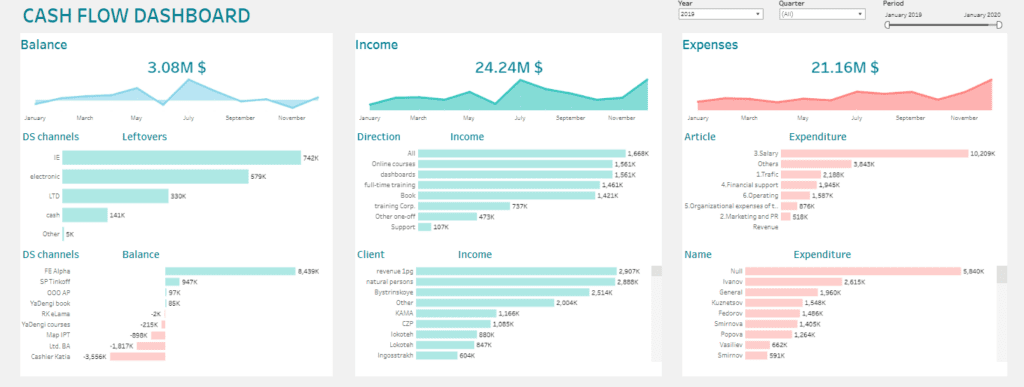
Key Charts in the Dashboard
- Line Charts – Track monthly dashboard cash flow trends for balance, income, and expenses, helping users identify seasonal fluctuations.
- Bar Charts – Break down cash dashboard components such as income by direction, client revenue, and expenditure categories, simplifying financial analysis.
- Stacked Bar Charts – Display financial leftovers and balances across different channels, offering insights into fund distribution.
- Comparison Charts – Highlight top-performing revenue sources and highest expenses, clearly showing financial strengths and weaknesses.
Who Would Find This Dashboard Useful?
- CFOs & Finance Teams – Monitor revenue, expenses, and financial health using a Tableau cash flow dashboard.
- Business Owners & Executives – Track profitability and assess cost allocation through a cash management dashboard.
- Accountants & Financial Analysts – Utilize cash flow dashboard examples for forecasting and budgeting improvements.
This dashboard cash flow visualization enhances financial transparency and supports strategic decision-making for businesses of all sizes.
A cash management dashboard is critical in financial control, offering businesses clear visibility into cash positions, revenue, and expenses. This blog’s examples of cash flow dashboards illustrate how organizations can customize dashboards to improve liquidity tracking and forecasting. Whether adopting a Tableau cash flow dashboard or other financial tools, the ability to analyze dashboard cash flow data leads to informed decision-making. By leveraging the right cash dashboard, companies can strengthen their financial strategy, reduce risks, and ensure sustainable economic health.