An audit dashboard is critical for organizations striving to maintain transparency, enhance compliance, and optimize resource allocation. By transforming complex data into clear visualizations, these dashboards enable internal auditors, finance teams, and compliance officers to uncover trends, identify anomalies, and streamline decision-making. Businesses leverage audit analytics to gain deeper insights into their financial processes, driving accountability and operational efficiency.
Related posts:
- Unlock the Power of Tableau Project Management: 7 Inspiring Dashboard Examples
- Top 5 Amazing Expense Dashboard Examples
- 7 Amazing Accounts Receivable Dashboard Examples to Improve Cash Flow and Collection Efficiency
- 6 Powerful Accounts Payable Dashboard Examples to Streamline Your AP Process
- 5 Powerful Risk Dashboard Examples Every Business Leader Should See
- 7 Amazing Help Desk Dashboard Examples
This post highlights five compelling audit dashboard examples, each designed to tackle specific auditing challenges such as expense tracking, fraud detection, and compliance monitoring, offering practical inspiration for crafting or enhancing your internal audit dashboard.
Table of Contents
# 1 Audit Dashboards – Expenses Audit Dashboard
This Expenses Audit Dashboard provides a comprehensive overview of financial expenses, offering key insights into spending patterns and showcasing how analytics in auditing can drive decision-making. It features several sections, each tailored for specific financial analysis:

- KPIs at the Top: High-level metrics like Total Amount (£517.1K), Average Amount per expense (£104.35), and Number of Expenses (4,955) are displayed with year-over-year (YoY) comparisons, shown in percentage changes. This internal audit dashboard delivers critical insights at a glance.
- Line Charts show trend analysis for total and average expenses and expense frequency over time. This enables users to identify patterns and anomalies, a key component of audit analytics.
- Bar Charts: The Total Expense by Department and Expense Type breakdowns visually rank departments and categories based on total spending. They include side-by-side YoY comparisons for context. These are excellent audit dashboard examples for tracking departmental costs.
- Employee Breakdown: A detailed table highlights the top 10 employees by expenses, showcasing individual claims, totals, and YoY changes to support analytics in auditing employee spending.
- Duplicate Payments: A table identifies duplicate expense claims, listing employees, dates, and amounts, ensuring efficient fraud detection with the help of a well-structured audit dashboard.
This dashboard empowers finance teams, auditors, and managers to optimize expense management, detect irregularities, and ensure compliance through effective internal audit analytics.
# 2 Audit Dashboards – Audit Tracker
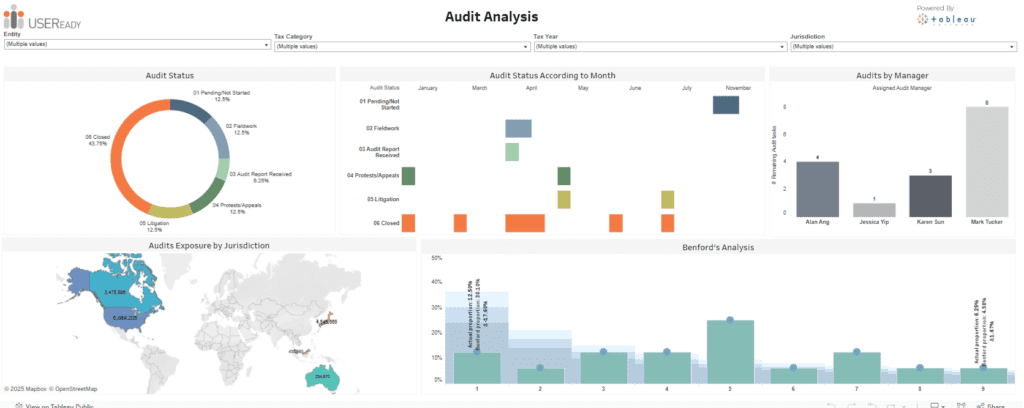
This Audit Analysis Dashboard provides a clear and comprehensive view of audit progress, status, and exposure, supporting efficient audit analytics. It is designed to assist internal auditors, audit managers, and compliance teams track and manage audit activities effectively.

- Audit Status Breakdown: A pie chart categorizes audits by status (e.g., Closed, Pending, Litigation), with percentages displayed. This feature offers a quick overview of audit distribution and highlights how analytics in auditing can streamline progress tracking.
- Audit Status by Month: A stacked bar chart visualizes audit progress over months, helping users identify trends in completion or delays. It serves as an excellent example of an internal audit dashboard guiding resource allocation and timeline adjustments.
- Audits by Manager: A bar chart shows the remaining audits per manager, enabling better workload management and accountability tracking. It demonstrates the use of audit analytics for team performance assessment.
- Geographical Exposure: A world map highlights audit exposure by jurisdiction, with numerical data overlaid for precise insights into regional risks and compliance needs. It is a vital component of audit dashboard examples.
- Benford’s Analysis: A histogram provides a statistical assessment of numerical data, helping to detect anomalies or irregularities in audit results. Thus, it further enhances the internal audit dashboard’s fraud detection capabilities.
This audit dashboard empowers users with actionable insights, ensuring efficient audits, risk identification, and transparency.
# 3 Audit Dashboards – Duplicate Payment Dashboard
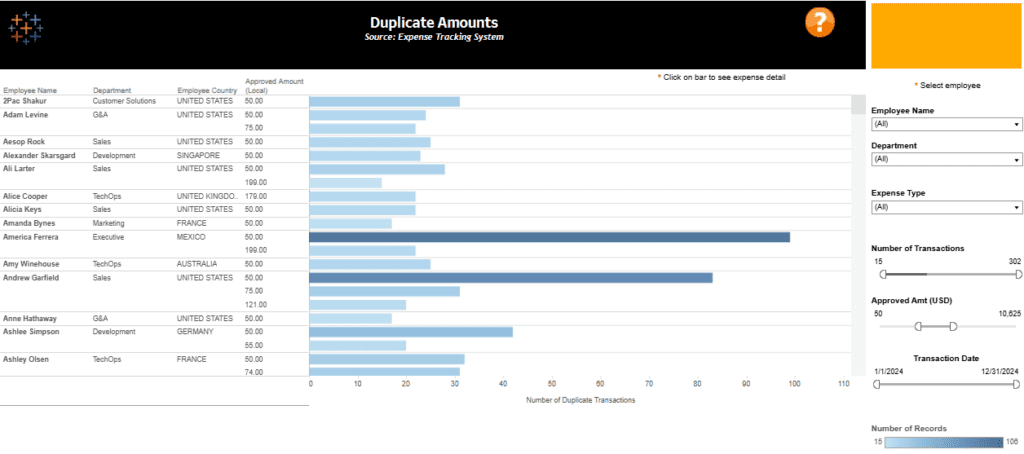
This Duplicate Amounts Audit Dashboard provides an in-depth analysis of potential duplicate transactions in an organization’s expense tracking system. It is tailored for financial auditors, compliance officers, and expense management teams to identify and address irregularities effectively.

- Bar Chart Visualization: The audit dashboard features a horizontal bar chart displaying the number of duplicate transactions per employee, categorized by department and country. This visual is a prime example of how audit analytics can quickly highlight employees with a high frequency of duplicate claims.
- Interactive Filters: The right-hand panel includes filters for Employee Name, Department, Expense Type, Number of Transactions, Approved Amount, and Transaction Date. These filters provide dynamic capabilities for analytics in auditing, enabling users to explore specific data points in depth.
- Employee-Level Insights: This detailed table lists employees, their departments, countries, approved amounts, and duplicate transaction counts. This granular view makes it an effective internal audit dashboard for monitoring spending patterns and ensuring compliance.
This internal audit dashboard helps uncover discrepancies in expense claims, reduce financial risks, and enhance transparency. As one of the practical audit dashboard examples, it demonstrates how audit analytics can empower organizations to make data-driven decisions in expense management.
# 4 Audit Dashboards – Internal Audit Demo (Expenses)
This Employee Expense Analysis Audit Dashboard provides a detailed breakdown of employee spending, categorized by department, expense type, and transaction details. It is a valuable resource for internal auditors, finance teams, and compliance officers to monitor and optimize expense management.

- Bar Chart Visualization: The audit dashboard features a horizontal stacked bar chart displaying approved amounts by employees across various departments, segmented by categories such as airfare, car rental, meals, and training. This visualization enhances audit analytics by identifying high spenders and uncovering key expense trends.
- Interactive Filters: The right-hand panel includes filters for Employee Name, Expense Type, Payment Type, Transaction Date, and Spend Category. These dynamic tools make the internal audit dashboard flexible, allowing users to drill down into specific data subsets for more targeted analysis.
- Detailed Expense Table: A summary table at the bottom outlines individual expense categories, totals, and types for specific employees. This level of granularity provides an audit trail that is essential for tracking spending behavior and ensuring compliance.
This internal audit dashboard exemplifies how audit analytics can detect irregularities, ensure policy adherence, and support cost-saving strategies. It enables data-driven decisions for effective expense management and compliance monitoring.
# 5 Audit Dashboards – Internal Audit – Expense Analysis
This audit dashboard provides a detailed and visual breakdown of expense analysis, focusing on departmental and categorical spending. It utilizes audit analytics to present actionable data for internal auditors, finance teams, and management.

The Spend by Department chart, presented as horizontal bars, ranks departments such as Sales, Marketing, and Development by total expenses. This feature helps users identify which departments incur the highest costs, making it a valuable tool for resource allocation and cost management.
The Spend by Category chart, also in a bar format, offers insights into significant expense categories like Meals, Lodging, and Ground Transportation. This enables users to pinpoint areas of considerable expenditure and assess spending behaviour, showcasing the practical application of analytics in auditing.
The Heatmap provides a temporal view of spending, highlighting high-expense days of the week and months of the year. This visualization is critical for identifying seasonal patterns or irregularities in expense timing.
Additionally, trend lines and sparklines following categories track changes over time, offering a dynamic perspective on financial trends.
This internal audit dashboard is one compelling example. It is designed to improve transparency, detect irregularities, and enhance decision-making through the power of audit analytics.
The five audit dashboard examples showcased illustrate the decisive role of analytics in auditing, providing innovative solutions for expense tracking, compliance oversight, and fraud prevention. These tools empower organizations with actionable insights, improve efficiency, and foster financial integrity. A well-designed internal audit dashboard helps mitigate risks and ensures informed decision-making, proving indispensable in today’s complex business environment. By integrating audit analytics, businesses can simplify auditing processes, meet compliance demands, and build a culture of accountability. Whether refining an existing dashboard or starting anew, these examples demonstrate the transformative potential of modern audit tools.


