What is a Tableau Finance Dashboard?
Want to sharpen your investing competitive edge? A Tableau finance dashboard can help you view and understand your financial data.
A Tableau finance dashboard could include various financial metrics and indicators, such as:
- Revenue
- Expenses
- Profit margins
- Cash flow
- Return on investment (ROI)
The dashboard gives users a clear overview of their organization’s financial performance. The interactive nature of Tableau financial dashboards allows your users to explore. This enables analysis and a better understanding of trends, patterns, and insights.
Tableau financial dashboards help financial professionals, executives, and stakeholders to:
- Watch financial data
- Track performance against targets
- Identify areas of concern
- Make data-driven decisions to optimize financial performance.
An Example of A Tableau Finance Dashboard
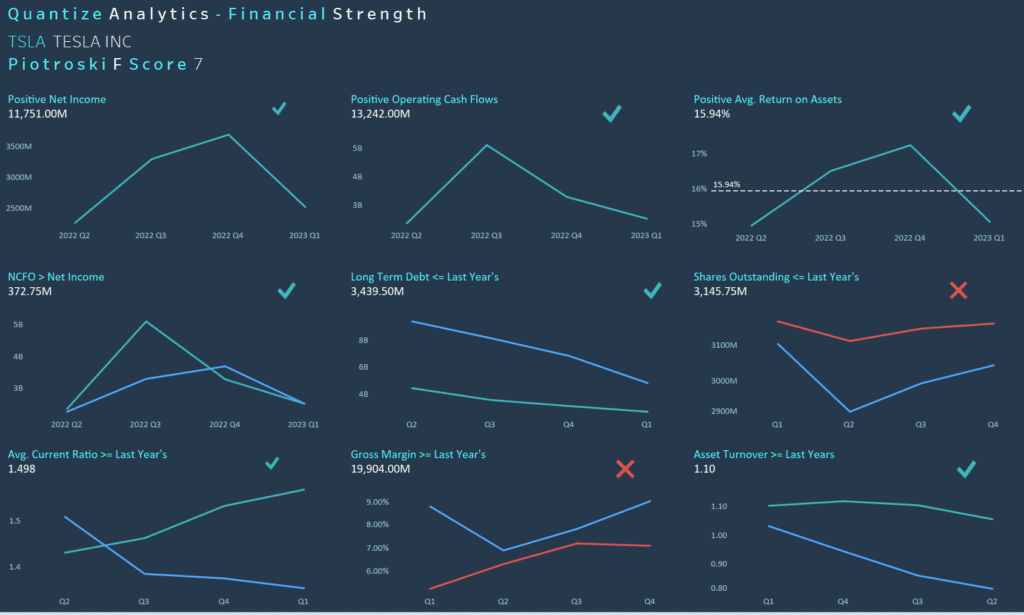
The Tableau finance dashboard above is about the Piotroski F-Score. A bit of background about this…
The Piotroski F-Score gets its name from its creator, Joseph Piotroski. It is a scoring system used to assess a company’s financial strength and quality. We can use nine financial criteria to assign a score ranging from 0 to 9. This evaluates the company’s fundamental health and potential for future performance.https://public.tableau.com/app/profile/simonjeffery83/viz/QuantitativeValueInvesting-FScore/FScore
The nine criteria used in the Piotroski F-Score have three categories:
- Profitability
- Financial health
- Operating efficiency
We give each criterion a score of 1 or 0. This depends on whether it meets certain predetermined thresholds. The scores are then summed up to get the final F-Score.
The nine criteria are as follows:
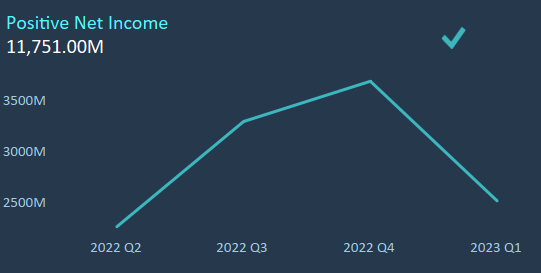
Positive Net Income
We score one if the company reports a positive net income in the current year and 0 otherwise. In the example below, we have positive net income in the current year so we would get a 1 for this test.
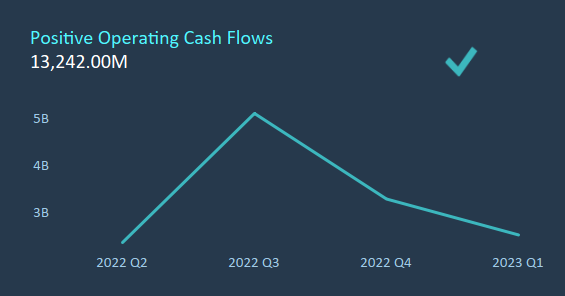
Positive Operating Cash Flow
We assign a score of 1 if the company generates positive operating cash flow in the current year. 0 otherwise. In the example below, the cash flow from operations is positive so we would get a 1 for this.
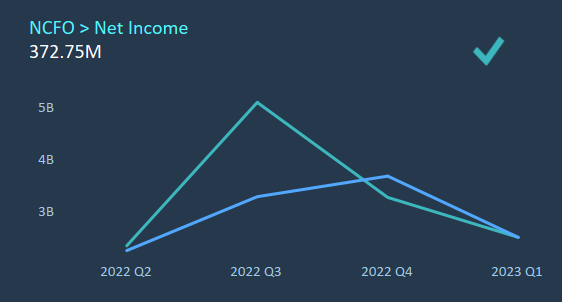
Earnings Quality
The finance dashboard gives a score of 1 if the company’s current year net cash flow from operations is higher than its net income. 0 otherwise. In the example below, we get a one because net cash flow from operations is more than net income for the year.
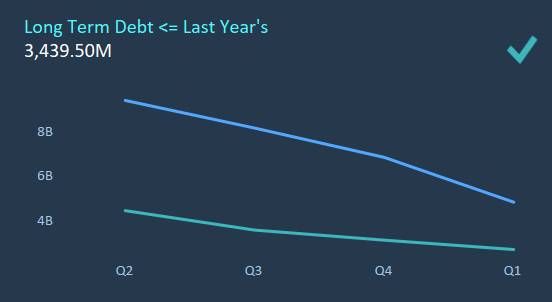
Lower Debt
We assign a score of 1 if the long-term debt is lower in the current year. 0 otherwise. We can see it is lower in the example below.
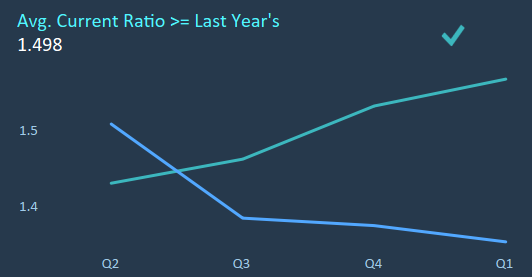
Increasing Current Ratio
We score one if the current ratio is higher in the current year. 0 otherwise. The example below shows that it has increased on average from the previous year to the current year.
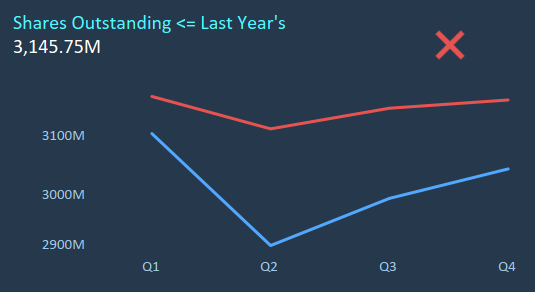
No New Share Issuance
The Tableau finance dashboard assigns one if the company did not issue new shares in the past year. 0 otherwise. Shares have increased in the example below, so we would get a 0.
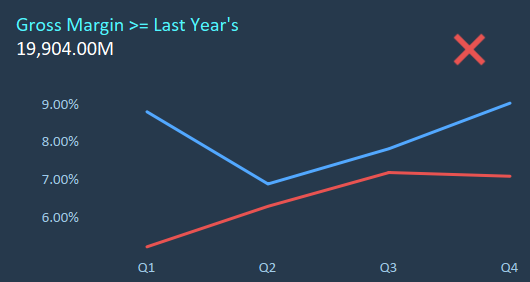
Increasing Gross Margin
We score one if the gross margin (gross profit divided by total revenue) is higher in the current year. 0 otherwise.
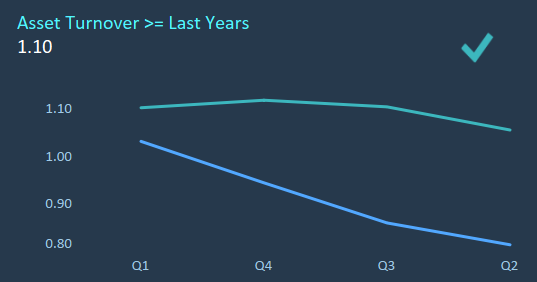
Increasing Asset Turnover
We assign a one if the asset turnover ratio is higher in the current year than in the previous year. 0 otherwise. We can see that the ROA is positive below. Hence, we get a 1 for this test.
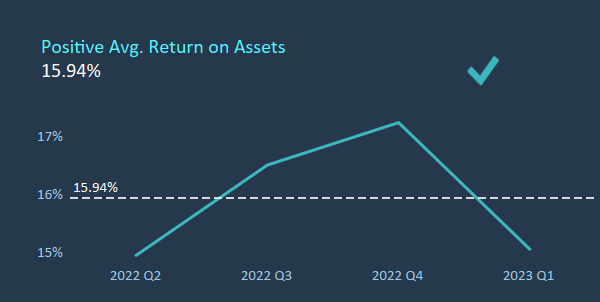
Operating Efficiency Improvement
We give one if the company’s return on assets (ROA) is higher in the current year than the previous year. 0 otherwise. We can see it has increased in the example below. Hence, we get a 1.
We calculate the final Piotroski F-Score by summing up the scores of the nine criteria. A higher score indicates better financial health and more robust fundamentals. At the same time, a lower score suggests weaker financial performance.

Above, we have the total F score for Tesla, which is 7, which is not too bad!
Who is the Ideal User of This Financial Dashboard in Tableau?
A dashboard that includes the Piotroski F-Score would typically be used by investors, analysts, and financial professionals interested in evaluating and comparing companies’ financial health and quality. Here are some specific user groups who might find value in a Piotroski F-Score dashboard:
- Investors: Individual investors, portfolio managers, and investment firms may use the Piotroski F-Score as part of their stock selection and evaluation process. By analyzing the F-Scores of different companies, investors can identify financially solid companies and potentially uncover investment opportunities.
- Analysts: Financial analysts and research professionals may utilize the Piotroski F-Score to assess the quality of a company’s financial statements and identify potential risks or red flags. The F-Score can be a starting point for further analysis and due diligence.
- Fund Managers: Mutual fund managers, hedge fund managers, and other investment professionals responsible for managing portfolios may utilize the Piotroski F-Score dashboard to evaluate the financial health of the companies they hold or are considering for investment. It helps them make informed decisions about portfolio allocation and stock selection.
- Financial Advisors: Financial advisors and wealth managers may use the Piotroski F-Score dashboard to support their recommendations and provide clients with insights into companies’ financial health and stability.
- Risk Managers: Risk management professionals within financial institutions or corporations may use the Piotroski F-Score in their risk assessment processes. By considering the financial health of companies, they can better evaluate the potential risks associated with counterparties or investments.
It’s important to note that the Piotroski F-Score is just one tool investors and financial professionals use to assess companies. It provides a quantitative measure of financial health, but additional analysis and qualitative factors should be considered to understand a company’s prospects and risks comprehensively.