Do you want to know how long customers are sticking around before they ghost you? Enter the Tableau cohort analysis dojo.
What is Tableau Cohort Analysis?
Tableau Cohort analysis studies customer groups with shared characteristics or behaviours. A Tableau consultant can gain insights into their purchasing patterns and retention rates. By analyzing cohorts over time, a Tableau expert identifies profitable opportunities for your business. The process involves defining cohorts, calculating metrics, visualizing the results, and providing insights. It helps your business to make data-driven decisions and boost profits.
Related posts:
- Tableau Customer Lifetime Value Dashboard – Your Keys to Sustainable Success!
- 11 Amazing Tableau Retail Dashboard Examples
- Boost Your Bottom Line with The Ultimate Product Dashboard!
- The Ultimate Guide to Choosing a Tableau Consultant UK
- Is Tableau Data Visualization Consulting Right for Your Business?
- 13 Amazing Tableau Financial Dashboards for Financial Mastery
Cohort Analysis Example Using Cohort Analytics Dashboard
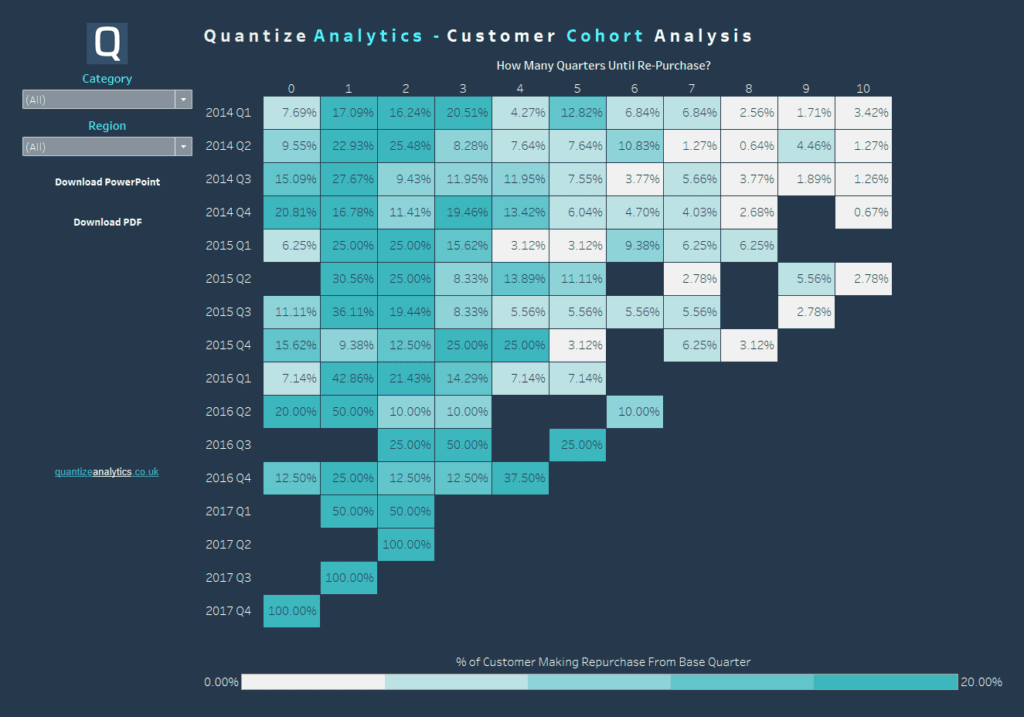
A Tableau consultant can use the Tableau cohort analysis dashboard to examine churn, retention, and repeat purchases. They can track the behaviour of customer groups over time and see if any profitable patterns can be uncovered. Once a profitable pattern is discovered, we can exploit it to our advantage.

In the cohort analytics dashboard above, we have the percentage of customers that have returned for a follow-up purchase after their initial purchase.
The Y-axis is the year and quarter, while the X-axis is the quarter from the first purchase date. The percentage in the cells represents the percentage of customers from a particular quarter who had completed a follow-up purchase in X quarters from the initial date of purchase.
For example, in the dashboard above, we can see in the first row, in Quarter 1 2014,
- 7.69% had a return purchase in the same quarter
- 17.09% had a return purchase in the next quarter
- After quarter 3, we see a drop-off in return purchases.
- The drop-off continues after quarter 5.
This is valuable information. Some insights that we can derive from all our customers are
- If they are likely to repurchase, it will be primarily in the next three quarters after the first purchase.
- If we have this knowledge, perhaps we can time the communication with customers, for example, a personalized deal, to coincide with their next expected purchase. E.g. One to three quarters after their initial purchase.
- The personalized deal could be something like upselling, cross-selling or volume discount. We know when the customer is likely to come back for a re-purchase. Therefore, we want to ensure they may wish to purchase additional products while they are back to boost profits.
The information uncovered above would be complicated to find without the data visualized in such an easy way. We want the patterns to be immediately apparent so we do not have to think hard.
Additional Benefits of Tableau Cohort Analysis
Uncovering Customer Secrets
Cohort analysis helps identify trends and patterns among specific groups of customers. You will understand their unique behaviours and preferences. The example above showed that repeat purchases were likely within three quarters. This helps us understand, in general, the buying behaviours of customers so we can take action.
Turning Insights to Action
Cohort analysis provides insights into the effectiveness of marketing campaigns and promotional activities. Helping businesses divide their marketing budgets more and make data-driven decisions. For example, if we offer customers deals when we know they will re-purchase.
Churn Reduction
If we know that a customer has not completed a repeat transaction by a specific time, they may be in danger of ghosting us. We can use the cohort analysis information to determine timeframes of at-risk churning. We can then remind customers of our existence to encourage them not to churn.
Empowering Data-Driven Decisions through Tableau Cohort Analysis
In conclusion, Tableau cohort analysis empowers businesses to uncover intricate user behaviour patterns and make data-driven decisions. By utilizing this methodology, companies can enhance customer retention, optimize strategies, and stay ahead in today’s competitive landscape. Through Tableau’s powerful tools and thoughtful analysis, cohort insights provide the keys to unlocking business success.


