Table of Contents
What is a Tableau Sales Pipeline Dashboard?
A Tableau sales pipeline dashboard is a way a sales team can get a quick overview of the sales process (and seal the deal!). They can see a simple breakdown of all sales process stages, from lead generation to closing those sweet deals. They can see all contracts in progress and each step of the buyer’s journey, including prospecting, qualification, proposal, negotiation and closure.
Related posts:
- How to Select the Best Tableau Sales Dashboard
- Boost Your Bottom Line with The Ultimate Product Dashboard!
- 13 Amazing Tableau Sales Dashboard Examples For Sales Analytics Mastery
- 7 Amazing Customer Dashboard Examples for Actionable Customer Insights
- 5 Powerful Revenue Dashboard Examples to Track & Boost Your Business Growth
- 7 Amazing Logistics Dashboards Every Supply Chain Leader Should See
Visual Representation of Opportunities
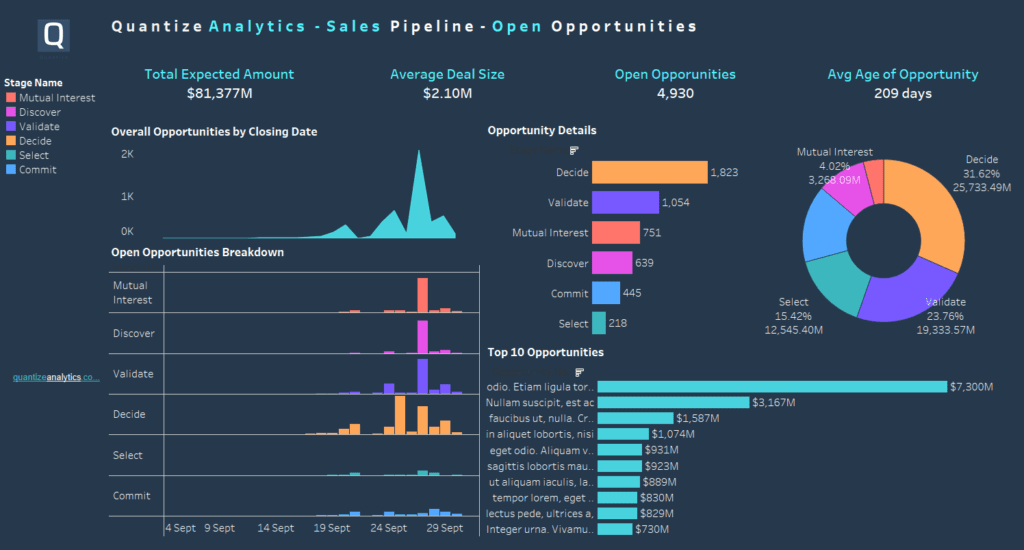
For a sales manager, a pain point may be the inability to track active opportunities due to a lack of visibility. A sales pipeline dashboard solves this, as all deal data will be available in real-time. Thus, the sales manager can easily track all aspects of a deal. Look at that great dashboard below.

Performance Analytics
A sales team may struggle with inefficient tracking of sales performance. With a Tableau sales pipeline dashboard, everyone on the team can view the following:
- The number of opportunities in each stage
- Average deal size
- Win rates
- Conversion rates
- Sales velocity
What Problems Can a Tableau Sales Pipeline Dashboard Solve?
Using a sales pipeline dashboard can solve problems sales teams encounter. Here are the top issues a sales pipeline dashboard can solve.
Lack of Visibility of Sales Pipeline
If there is a lack of visibility, the sales team may have no unified effort. Each member of the sales team exists in their information bubble. They will all be pulling in different directions. The team cannot see the inefficiencies because it is not easy to compare performance. A Tableau sales pipeline dashboard fixes this, as there is a single source of truth. They can focus attention on high-value deals and avoid dead ends. A Tableau sales pipeline dashboard is not a magic bullet; we need high-quality sales data.
Bottlenecks
Is a deal taking too long to close? Is the conversion rate with a particular type of client too low? Perhaps a specific member of the sales team that seems to be underperforming? A sales manager can investigate these issues and take action to remediate them. With a Tableau sales pipeline dashboard, they can uncover these issues in minimal time.
Unprioritized Opportunities
We do not want to treat every deal or opportunity as equal. This would be a total waste of resources. Instead, we want to know which options will yield the best result and focus on those. With a sales pipeline dashboard, we can rank high-value opportunities. We can also see low-value opportunities and put them at the bottom of the to-do pile. Either way, we have this information instantly.
Poor Time Management
Suppose a sales team is chasing its tale without a sales pipeline dashboard. There are problems with disparate data sources, outdated sales data, or random spreadsheets. All are leading to reducing time spent on actually closing deals. Having a convenient sales pipeline dashboard will circumvent all these nasty problems.
What Sales Pipeline Metrics Would You See In A Sales Pipeline Dashboard?
This depends on what the sales team or manager wants to track. The advantage of having a customized Tableau dashboard is that you can follow what you like. We will consistently build dashboards based on the users’ requirements. Some metrics may include the following:
Average Sales Cycle Length
This is the time, usually in days, from when the lead came in until the deal closed. This will help us identify quick wins or deals that have dragged on longer than expected in sales purgatory. We can focus more attention on more accessible deals and cull the rest.

Leads By Source
The categorization of leads from which source we obtained them. We can cross reference this information with conversion rates (see below). We need to stop spending marketing money on dud sources.

Pipeline Stage Conversion Rate
The percentage of leads/deals that escalate to the next stage. We want to pump these rates for maximum success. We can also see where things are going wrong in the sales cycle and fix it to seal the deal.
Opportunity Win Rate
Percentage of deals that have been victoriously closed. We want to pump this number. We can use this to track deal types that always fail; we could avoid these altogether if they are in the too-hard pile.
Pipeline Value
The point-in-time potential revenue that the pipeline can generate with all existing deals. Some salespeople may over-inflate these figures to feel good about themselves momentarily. We can also weigh this figure with the probability of the value closing to make it more realistic for everyone.
Closing Opportunities by Source
A good metric to show which sources are leading to sweet revenue. We can increase marketing spend for successful lead generators and kill the rest.
New Deals Created
This is the fresh meat for the sales pipeline grinder. It is the count of generated sales opportunities. New deals are the lifeblood of any sales pipeline.
Deals Won Amount
Total monetary value or revenue generated from closed sales deals or opportunities. This may be of interest when it comes time for annual bonuses.
Next Steps for You!
If you have sales pipeline data that needs a home, you need a Tableau sales pipeline dashboard. If you have janky spreadsheets or are spending too much time updating many versions of a janky spreadsheet, fret no more. A solution to all your sales pain points exists with a Tableau sales pipeline dashboard. Seal the deal with a sales pipeline dashboard. Get in touch if you want to talk about your sales pipeline!


