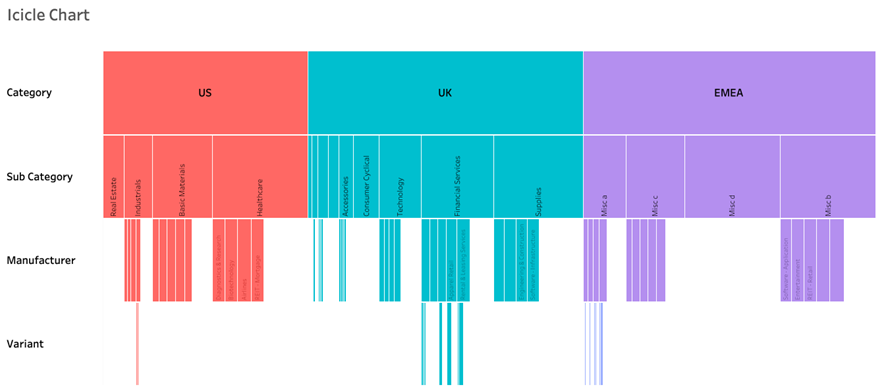
How to Make an Cool Tableau Icicle Chart
What is a Tableau Icicle Chart? What is a Tableau Icicle chart and why would we use it? An Icicle Chart is a way of

What is a Tableau Icicle Chart? What is a Tableau Icicle chart and why would we use it? An Icicle Chart is a way of

What is a Tableau Marimekko Chart? A Marimekko chart, also known as a Mekko chart or market map, is a type of visualization used primarily
Welcome to our Tableau Consulting Services. We specialize in helping businesses optimize their data analysis and decision-making capabilities using Tableau.
Expert Tableau Consulting Services and Solutions
Quantize Analytics Ltd. 11097872