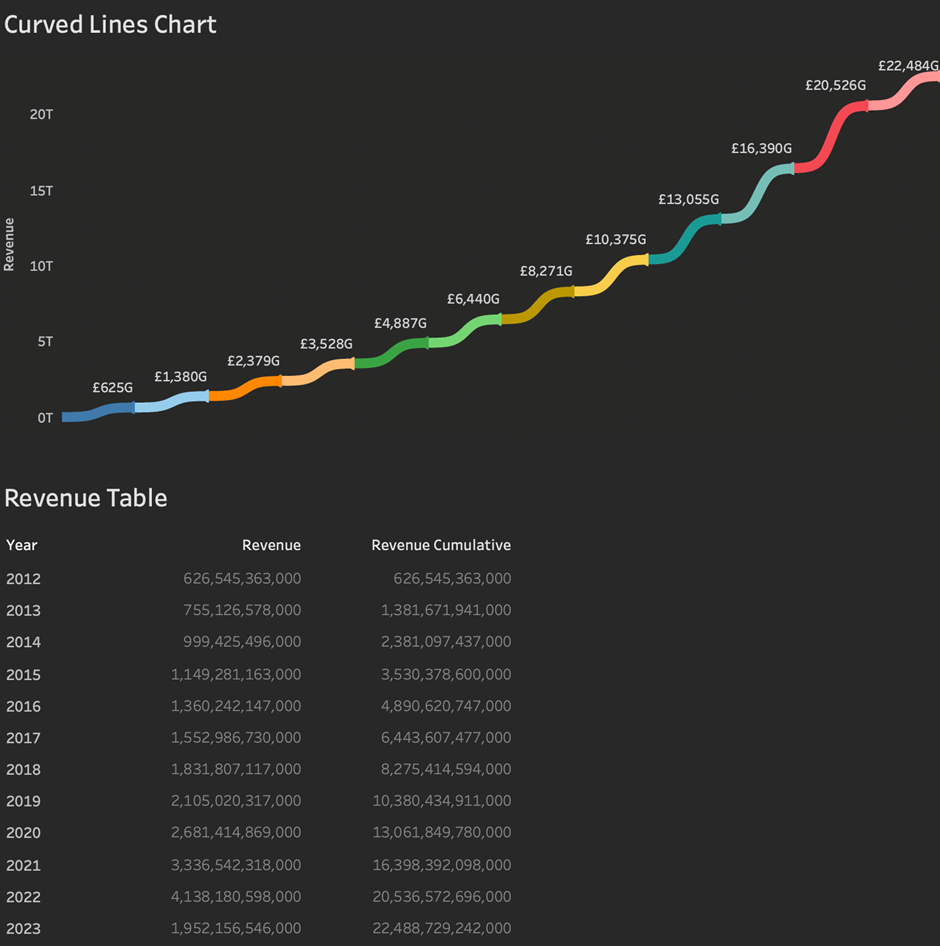
How To Make A Tableau Curved Line Chart in 10 Minutes
What is a Tableau Curved Line Chart? A Tableau Curved Line Chart is a variation of standard line charts. They look more interesting but the

What is a Tableau Curved Line Chart? A Tableau Curved Line Chart is a variation of standard line charts. They look more interesting but the
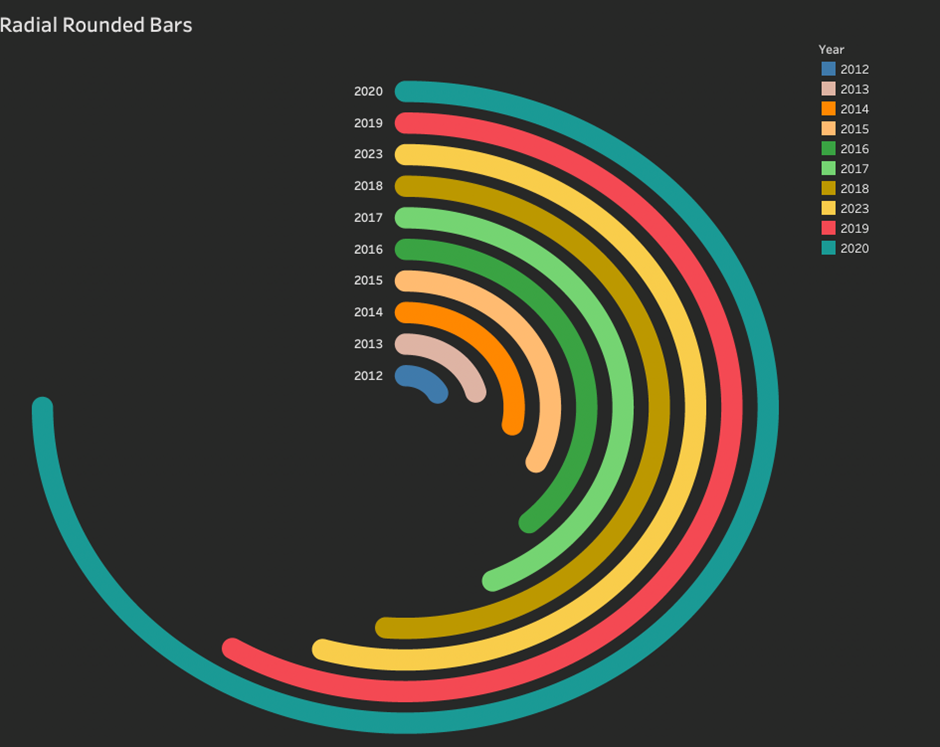
What is a Tableau Radial Rounded Bar Chart? A Tableau Radial Rounded Bar Chart is a standard rectangle bar chart variation. The bars are arranged
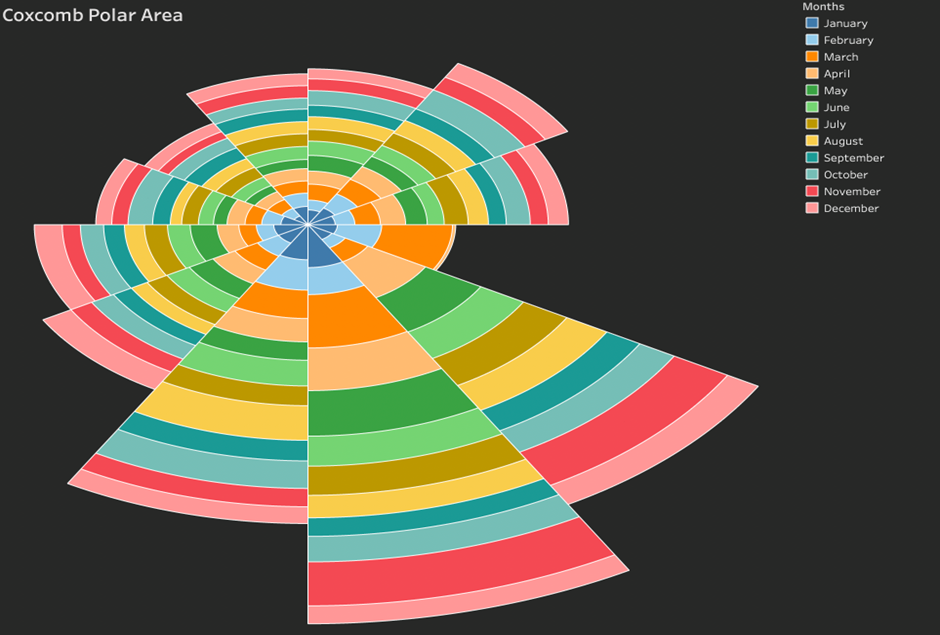
What is a Tableau Coxcomb Polar Area Chart? A Tableau Coxcomb Polar Area chart is a way of visually representing quantitative values across different dimensional
