How to make a Tableau Jitter Chart in 10 minutes
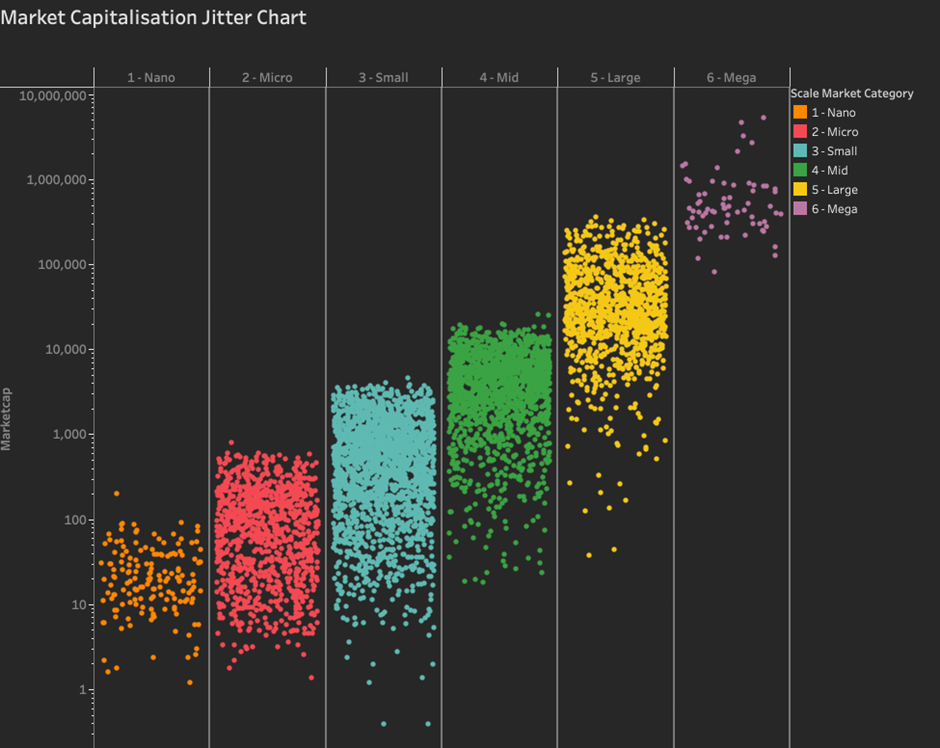
Data Set for Tableau Jitter Chart If you want to follow this tutorial, here is the dataset. What is a Tableau Jitter Chart? A Tableau

Data Set for Tableau Jitter Chart If you want to follow this tutorial, here is the dataset. What is a Tableau Jitter Chart? A Tableau

Welcome to our blog series, where we unveil 13 innovative Tableau sales dashboard examples. In the rapid rhythm of today’s business landscape, mastering your sales
