Tableau Gradient Area Chart In A Simple 5 minutes
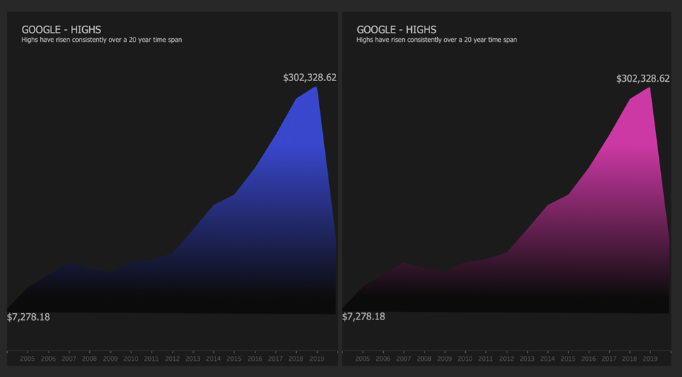
What is a Tableau Gradient Area Chart? If you only have one line for your time series chart, converting it to a Tableau Gradient Area

What is a Tableau Gradient Area Chart? If you only have one line for your time series chart, converting it to a Tableau Gradient Area

Welcome to our focused exploration of financial data visualization, where we present seven distinct Tableau income statement examples. Through this blog post, we’ll showcase how
