Explore 29 Awesome Examples of Tableau Line Charts
Welcome to our latest blog post, where we delve into the world of Tableau line charts, an essential tool in the arsenal of data visualization.

Welcome to our latest blog post, where we delve into the world of Tableau line charts, an essential tool in the arsenal of data visualization.

Data For Tableau Rounded Bar Chart Tutorial To follow along with this tutorial, download the data below What is a Tableau Rounded Bar Chart? Tableau

Data Set for Tableau Jitter Chart If you want to follow this tutorial, here is the dataset. What is a Tableau Jitter Chart? A Tableau

Welcome to our blog series, where we unveil 13 innovative Tableau sales dashboard examples. In the rapid rhythm of today’s business landscape, mastering your sales

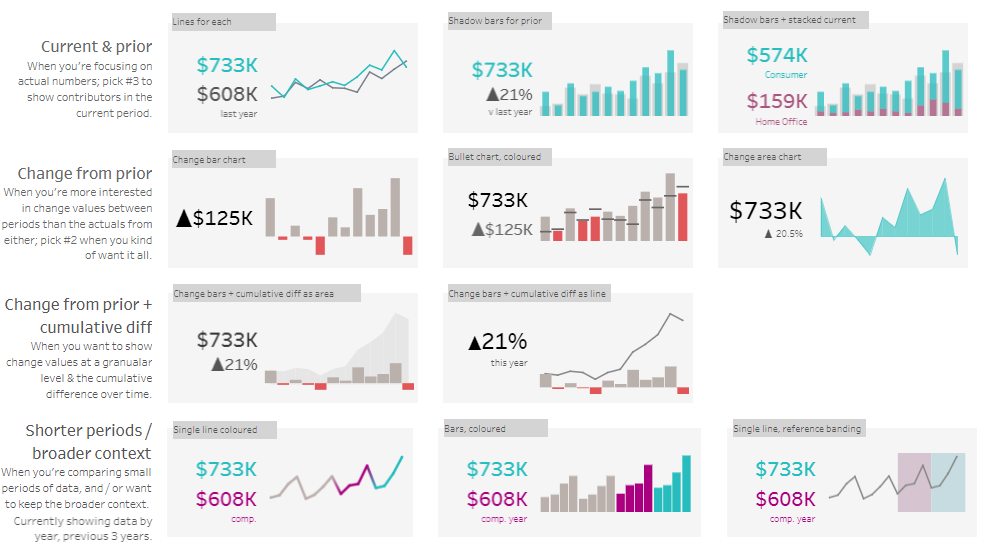
This blog post is a comprehensive guide to Tableau period comparison. Tableau data analysis offers a powerful lens for comparing current performance against historical benchmarks.

To learn Tableau as a beginner opens up a world of possibilities in data visualization and business intelligence. This comprehensive guide will walk you through

What is a Tableau Radial Times Series Chart? Most standard charts have a radial version that looks more trendy. In many cases, these fancy chart

Embark on a journey through the world of financial clarity as we explore five captivating Tableau balance sheet examples (exciting!). Renowned for its robust analytics,

What is a Tableau Gradient Area Chart? If you only have one line for your time series chart, converting it to a Tableau Gradient Area

Welcome to our focused exploration of financial data visualization, where we present seven distinct Tableau income statement examples. Through this blog post, we’ll showcase how
Welcome to our Tableau Consulting Services. We specialize in helping businesses optimize their data analysis and decision-making capabilities using Tableau.
Expert Tableau Consulting Services and Solutions
Quantize Analytics Ltd. 11097872