How to Build a Professional Branded Tableau Dashboard with Tableau and Figma
Tableau and Figma: Recently, we worked on a project where the client wanted a financial dashboard. This dashboard was to look good and work well

Tableau and Figma: Recently, we worked on a project where the client wanted a financial dashboard. This dashboard was to look good and work well

A common issue that comes with Tableau is sharing Tableau dashboards with clients. Tableau Desktop is an unparalleled tool for crafting interactive visualizations, meeting various

Bar Chart Tableau. Here’s a fast and easy way to get there in 5 minutes.

Easy 10 minute Tableau Waffle Chart

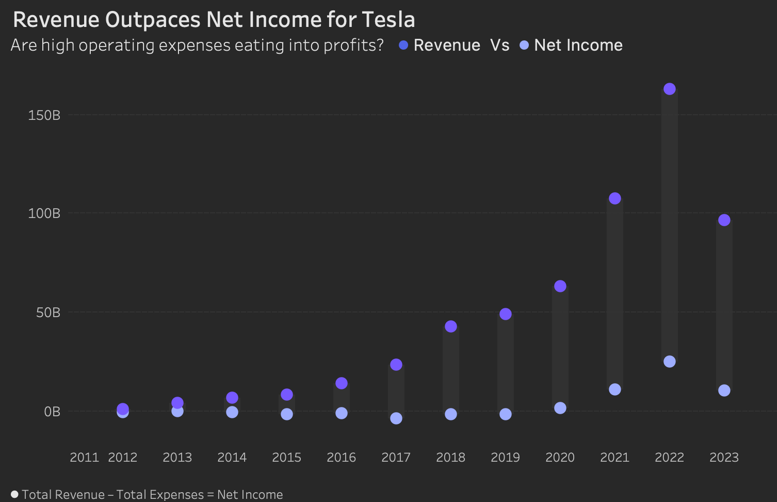
So, how do you make a great Tableau Dumbbell chart to visualize performance gaps? Are you visualizing the difference between two metrics or two groups?

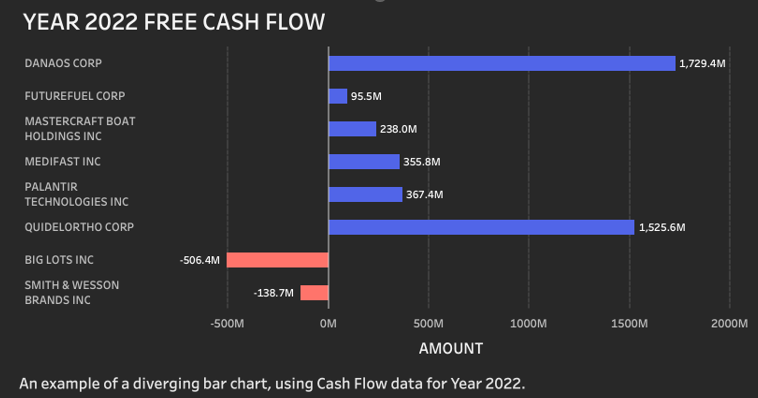
How to Create a Diverging Bar Chart in Tableau Bar charts are a staple in data visualization due to their immense flexibility and ease of
Welcome to our Tableau Consulting Services. We specialize in helping businesses optimize their data analysis and decision-making capabilities using Tableau.
Expert Tableau Consulting Services and Solutions
Quantize Analytics Ltd. 11097872