Are you considering using Tableau for your company’s financial statements to create a Tableau Income Statement Dashboard or Balance sheet?? Dive into this blog to discover the benefits and know-how of Tableau-powered financial reporting.
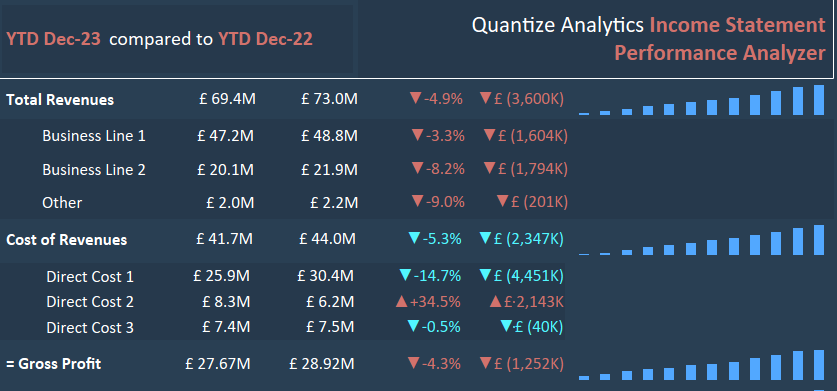
Table of Contents
Can Tableau Create Financial Statements?
Yes, Tableau can create financial statements. Using Tableau, financial reporting – such as Profit and loss (P&L) reports, balance sheets, and cash flow statements – becomes dynamic, interactive, and automated. Tableau enables finance teams to combine data, provide efficient analysis and reporting, and securely share information influencing business strategy. This eliminates reliance on manual processes and spreadsheets and delivers robust analytics on a flexible, governed platform. Financial statements can be generated to show a company’s revenues and expenses over a specified period, transforming raw financial data into a discernable net income figure.
Can Tableau be Used for Accounting?
Tableau can be used for accounting purposes. It lets users appraise financial results through income statements, waterfall charts, and annual reports. It also enables users to simulate the Income Statement using What-If Analysis. This can answer critical business questions about an organisation’s financial status, performance, expected future growth, and profitability. Finance teams use Tableau to efficiently analyze, report, and securely share vital financial information, driving strategic business decisions.
Is Tableau Suitable for Accounting?
Tableau is highly regarded for accounting. It surpasses traditional tools like Excel by offering exceptional financial reporting services that are dynamic, interactive, and automated. It allows accounting professionals to:
- Efficiently analyze and visualize financial data, including revenues, expenses, and profitability.
- Generate comprehensive financial reports, such as income statements, which can be customized and interactive.
- Perform What-If Analysis to simulate different financial scenarios.
- Monitor and improve Key Performance Indicators (KPIs) like revenues and expenses.
Moreover, Tableau’s ability to handle a complex data model and provide an interactive and user-friendly Tableau income statement dashboard underscores its utility in effectively managing and presenting accounting information in a manner that is both insightful and accessible to various stakeholders within a company.
What Should Be in the Tableau Income Statement Dashboard?
As seen above, the Tableau income statement dashboard provides a versatile and dynamic spreadsheet-like view of accounts while ensuring increased flexibility. Key features of this dashboard include:
- Data Model: Utilizing a complex data model, possibly built using an analytics engineering tool like Alteryx or Python script, the dashboard allows different schemas depending on the selected company, ensures account information is displayed correctly, and facilitates proper formatting (such as bolding and indenting).
- Collapse/Expand Logic: It incorporates three hierarchical levels: account category, account type, and account description, with functionalities that allow users to collapse or expand account categories to show or hide details.
- Other Functionality: The user can toggle between a monthly and yearly view, filter specific months or entire years, and utilize helpful features such as sparklines to highlight trends and potentially a pop-out button leading to a more detailed account view.
This dashboard is particularly beneficial for accountants, company leadership, and board members, especially in companies that require consolidating several companies into a single income statement.
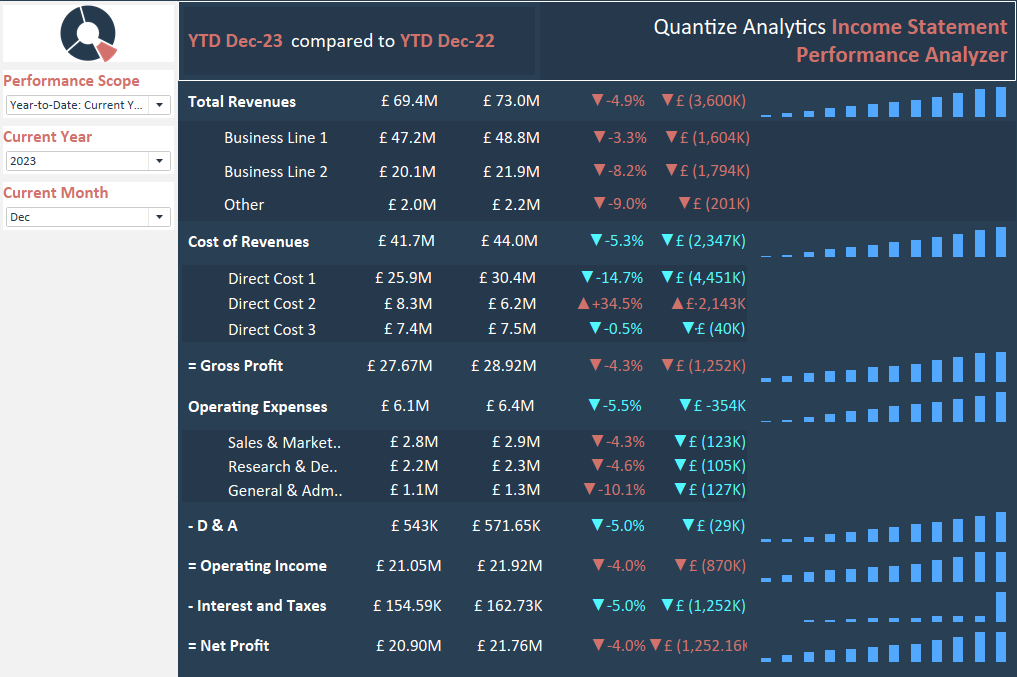
The “Quantize Analytics Income Statement Performance Analyzer” dashboard, presented in Tableau, provides an advanced accounting solution tailored for modern businesses. Here’s a deep dive into its functionalities:
- Dynamic Time Filtering: The “Performance Scope” feature facilitates financial period selection. This adaptability ensures financial data, whether monthly or Year-to-Date, is always relevant and timely.
- Revenue Insights: “Total Revenues” section methodically segregates earnings into distinct business lines. This segmentation makes it straightforward for accountants to track and analyze the revenue streams, identifying areas of growth or concern. The dashboard highlights variances against previous periods, a key indicator of financial trajectory.
- Detailed Expenditure Analysis: The “Cost of Revenues” section breaks down costs, offering a granular view of where funds are allocated. Such transparency is essential for budgeting, forecasting, and understanding the company’s cost structure.
- Profit Metrics: “Gross Profit” and “Net Profit” are displayed, providing instant insights into the company’s profitability. These metrics are foundational for any accounting analysis.
- Operational Expense Overview: The solution meticulously categorizes “Operating Expenses,” ensuring clarity in understanding overheads and managing budgets effectively. From sales expenses to R&D, the tool offers a comprehensive overview.
This dashboard is a comprehensive accounting solution, enabling businesses to make data-driven decisions, optimize financial operations, and streamline reporting.
What Are the Benefits of Tableau Income Statement Dashboard Over Excel?
- Embracing Visualization: Excel has undoubtedly been a trusted companion for years in handling spreadsheets, calculations, and basic charts. However, Tableau elevates data representation with its interactive dashboards. Instead of presenting your data in rows and columns, imagine showcasing trends, patterns, and forecasts in visually appealing graphs that your leadership team can quickly understand and act upon.
- Handling Big Data: Large datasets are a reality in today’s digital age. While Excel has its strengths, it might sometimes stumble when processing vast data. Conversely, Tableau is designed to analyze large datasets, seamlessly ensuring swift and efficient processing.
- Data Connectivity: Diverse data ecosystems are commonplace now. Tableau’s ability to connect to various data sources, from cloud services to SQL databases, provides an edge for organizations seeking comprehensive data integration solutions.
- Usability: While your team might be proficient in Excel, there’s no denying that mastering complex formulas and functions can be time-consuming. Tableau’s intuitive drag-and-drop interface can be a game-changer. It allows even those less acquainted with data analytics to create insightful visualizations.
- Collaborative Efforts: Financial insights must be shared, discussed, and sometimes modified. With platforms like Tableau Server or Tableau Online, your team can collaborate in real time, making it easier than navigating through multiple versions of an Excel file.
While Excel will always have its place in the accounting world, I’d encourage you to explore the capabilities of Tableau. It might just be the tool that propels your accounting department into a new era of data-driven decision-making.
Conclusion
The Tableau Income Statement Dashboard transforms how we visualize and interpret financial data and offers interactivity and efficiency that traditional methods can’t match. As businesses evolve, so should our tools and techniques. Embracing innovations like Tableau can undoubtedly set the stage for more informed decision-making and strategic planning. Whether you’re a seasoned accountant or a business leader, it’s time to explore the future of financial reporting.