How to Create a Diverging Bar Chart in Tableau
Bar charts are a staple in data visualization due to their immense flexibility and ease of interpretability. This post will focus on creating a specific type — a Tableau diverging bar chart.
Diverging bar charts excel in showing positive and negative quantities in your data. In a Tableau diverging bar chart, a set of bars runs in the positive direction, and another group runs in the descending order. The positive and negative amounts tend to be sorted, so they are next to each other.
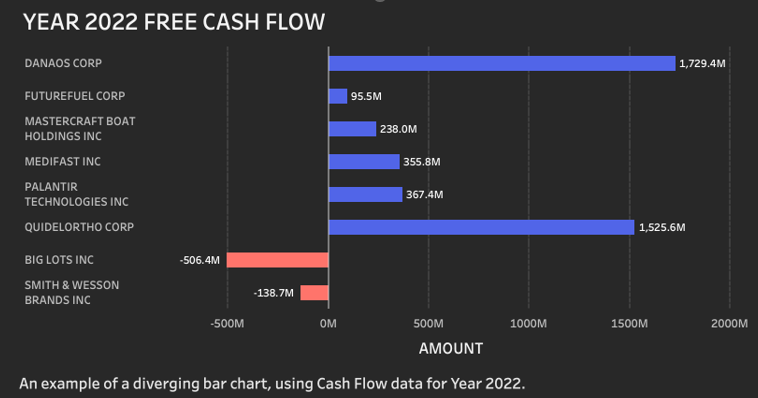
In this example, we will use financial data (cash flows), which were negative for some companies and positive for others in 2022. You will see that it is pretty easy to create this visualization!
Table of Contents
Data Download for Tutorial on Tableau Diverging Bar Chart
You can download the data set here to follow along to create your diverging bar chart in Tableau.
Step 1: Create a Calculated Field for Tableau Divering Bar Chart
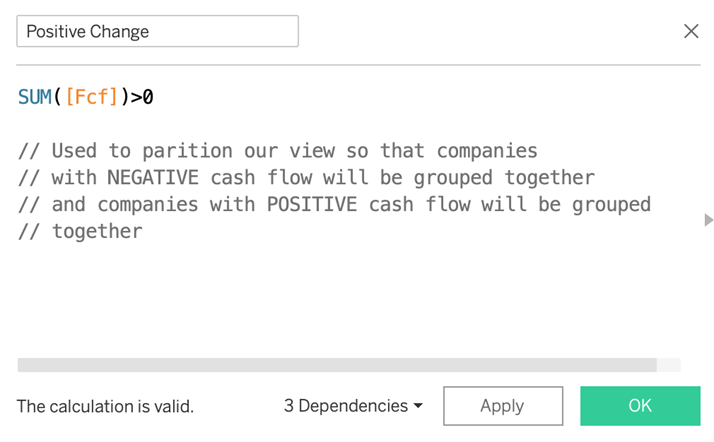
Create a calculated field to determine the direction of the data. Here, we use the name “Positive Change”, but name it however you wish.
The field should be: SUM(FCF) > 0
Step 2-9: Drag Fields to Relevant Positions
2. SUM(fcf) onto columns.
3. “Positive Change” (our calculated field) to rows.
4. Name onto rows in the 2nd position.
5. Year onto Filters. (Select the year 2022 for this chart).
6. Name onto Filters. Filter out Alibaba, Alphabet, Amazon, Meta, Taiwan Semiconductor, and Tesla

a. Values for these companies will skew our chart.
7. Positive Change to colour on the marks card. Colour as desired.
8. SUM(fcf) to Text on the marks card. Format as Tableau Book, Size 8.
9. Add a reference line at 0 to make the divergence effect pop even more. Colour as #D4D4D4.
Voila! You now have a Tableau diverging bar chart like the screenshot below. But notice significant improvements can be made to take it to the next level.
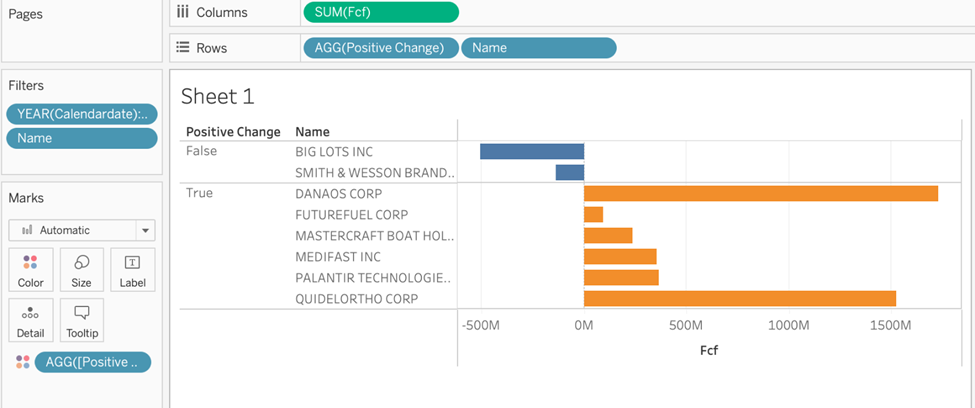
It is a great idea to make all titles and labels informative. The bars can also be reordered so that positive values are on top and negative values are on bottom. Remember to hide the True/False field by selecting your calculated field and deselecting “Show header”.
Finally, you can make additional improvements in the format section by removing grid lines, axis rulers, axis ticks, and column, row, and header divider lines.
Step 9-13 Styling the Chart
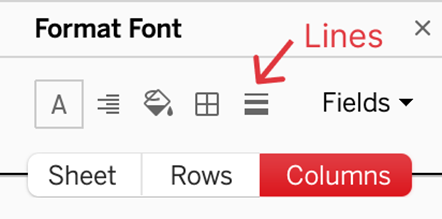
9. Set Column Grid Lines to Dashed, Hex colour #555555. Otherwise, remove all lines between Columns, Rows, and Sheet… by setting all Grid, Zero, Axis Lines, and Axis ticks to None.
10. For Borders, set all borders for Sheet, Columns, and Rows to None.
11. For Background, set worksheet background to #282828.
12. For Font, set Header to #C0C0C0. Also, set the X-Axis text to #C0C0C0 Tableau Medium Bold by right-clicking on the x-axis and selecting format. Company Names and X-Axis text should now appear grey.
13. Double-click on the chart title and format the title to be #F5F5F5, Tableau Medium size 18.
Conclusion

Hopefully, you’ve formatted your chart to the next level. Isn’t it beautiful? By now, you know that a diverging bar chart is an excellent way to compare groups with positive and negative differences.
We hope that after this tutorial, you have now added this chart type to your visualization arsenal!
If you are interested in other exciting ways to visualize data, see our other tutorials on advanced Tableau charts!
Contact us if you want to see a Tableau chart-type tutorial; let us know, and we will create the tutorial for you.